

Overview
Abstract
Substances, including drugs, gases, and hormones, are transported through the body within the bloodstream and airflow in the Cardiovascular and Respiratory Systems, respectively. This provides important nutrients and waste removal for normal physiologic function. The BioGears® engine models advection in both fluid systems (see Substance Transport Methodology). Transvascular transport is simulated using one of several diffusion models (see Tissue Methodology) for substances generically. Drug transvascular transport is modeled with a physiologically-based pharmacokinetic (PBPK) model, and the physiologic effects on the body are modeled with a low-fidelity pharmacodynamic (PD) model.
Introduction
Drugs influence the body by moving it out of homeostasis for a specific purpose, such as sedation for surgical intervention, or to address a patient condition, such as analgesic intervention. After a drug enters the patient’s body (through intravenous administration, absorption through the gastrointestinal system, or inhalation of an agent), the substance ultimately is transported through the bloodstream for uptake by the tissues and organs. The process of clearing a drug from the system is accomplished in a combination of three methods: renal clearance, hepatic clearance, and systemic clearance. Depending on the drug, it may be processed by either the kidney, the liver, or both for removal from the system as a waste product. Additionally, drugs are metabolized by the body and removed from the bloodstream. These methods all reduce the amount of drugs in the system. The drug transport and clearance methodologies in BioGears are described below.
System Design
Background and Scope
Pharmacokinetics is the study of the relationship between the dose of a drug and the time-evolution of the concentration of the drug throughout the body. The relationship between the concentration of a drug and the physiological response is described by the pharmacodynamics [293]. BioGears has both pharmacokinetic and pharmacodynamic models. Because it is physiologically-based, the pharmacokinetic model has resolution at the same scale as the cardiovascular and respiratory systems. Physiologically-based pharmacokinetic (PBPK) modeling is a technique that mathematically models the distribution, uptake, metabolism, and clearance of a drug with consideration of the relevant physiological processes [160]. The PBPK model provides more resolution than the classic one and two compartment models. The PBPK model also provides a base on which to build a receptor-based pharmacodynamic (PD) model, although the BioGears PD model is currently a lower-fidelity phenomenological model based solely on the concentration of a drug in the blood. Drugs impact body-level physiologic behavior such as heart rate, respiration rate, and blood pressure as result of cellular-level interactions caused by a drug that changes the behavior of physiologic entities, such as blood vessels and electrical activity in the heart. The cellular-level processes are not modeled in BioGears, and instead the PD model is a direct relationship between concentration and maximum effect for a body-level response.
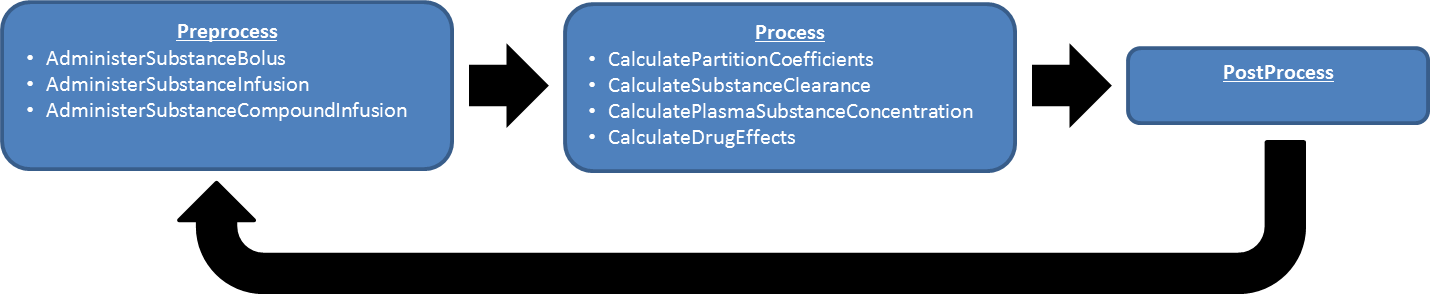
Data Flow
Preprocess
Administer Substances and Administer IV Substances
All substances added or removed from the BioGears body are incremented or decremented from the appropriate compartment during the Preprocess step. For example, if substances are administered via a bolus injection or through intravenous administration, the substance mass is increased in the vena cava compartment.
Process
The generic substance methodology developed for the BioGears Engine is used to solve for the mass, concentration, substance volume, and volume fraction in each compartment. After the masses and concentrations have been updated, the system-level effects of any circulating drugs are calculated using the pharmacodynamic model.
Post Process
The Post Process step moves everything calculated in Process from the next time step calculation to the current time step calculation. Substances have no specific Post Process functionality. Each system post processes their circuit and moves the mass, concentration, substance volume, and volume fraction from next to current.
Features, Capabilities, and Dependencies
Pharmacokinetic models quantify the time evolution of drug distribution from the administration of a dose. Pharmacodynamic models, on the other hand, characterize the events from the arrival of the drug at the site of action to the �onset, magnitude and duration of the biological response" [293]. The BioGears Drug system contains both pharmacokinetic and pharmacodynamic models.
Pharmacokinetics
The pharmacokinetic (PK) methodology provides a means for simulating the time-evolution of the distribution of a drug throughout the body. This is accomplished by using the administration actions discussed in the Actions section below, the transport methodology, the perfusion limited diffusion methodology, and the substance files discussed in the Common Data Model documentation. Once a drug is administered, it either enters the Cardiovascular System (liquid) or the Respiratory System (inhaled). If it is an inhaled drug, modeled in BioGears as a gas, the drug will move into the alveoli through advection then diffuse into the Cardiovascular System through alveoli transfer. Drug effects, described below in the Pharmacodynamics section, are then computed based on the concentration of the drug in the plasma. Note that the plasma concentration calculation is currently incorrect. The concentration of a drug is currently computed by dividing the mass of the drug in a compartment by the volume of plasma, as computed from the hematocrit. Implicit in the plasma concentration calculation is the assumption that all of the drug is in the extracellular space. In actuality, some of the drug will cross blood-cell membranes, and the concentration of drug in the plasma and in the blood is a function of many factors, including the lipophilicity. We will address this error in the future.
Partition Coefficient
The drugs circulate around the cardiovascular circuit via the generic transport methodology described in the Circuit Methodology. However, drugs diffuse from the Cardiovascular System into the tissues via perfusion limited diffusion. For each drug, the physicochemical properties are used to calculate the partition coefficient. This partition coefficient describes the tendency of a particular drug to diffuse across the barrier between the cardiovascular and tissue spaces. Partition coefficients are calculated using physiochemical properties defined in the substance file associated with a drug. For a very weak base, an acid, or a neutral, Equation 1 is used to calculate the partition coefficient.
\[{K}_{pu} = f_{EW} + \frac{X * f_{IW}}{Y} + \frac{P * f_{NL} + (0.3 * P + 0.7) * f_{NP}}{Y} + \left[\left(\frac{1}{f_{u}} - 1 - \left(\frac{P * f_{NL} + (0.3 * P + 0.7) * f_{NP}}{Y}\right)\right) * \frac{PR_{T}}{PR_{B}}\right] \]
For moderate to strong bases, Equation 2 is used to calculate the partition coefficient.
\[{K}_{pu} = f_{EW} + \frac{1 + 10^{pK_{a}-pH_{IW}} * f_{IW}}{1 + 10^{pK_{a}-pH_{p}}} + \frac{K_{a}*AP_T*10^{pK_{a}-pH_{IW}}}{1+10^{pK_{a}-pH_{p}}} + \frac{P * f_{NL} + (0.3 * P + 0.7) * f_{NP}}{1+10^{pK_{a}-pH_{p}}}\]
Where X and Y are the different relationships for pH, as shown in Table 1, fIW is the fraction of intracellular water, fEW is the fraction of extracellular water, fNP is the fraction of neutral phospholipids in the tissue, fNL is the fraction of lipids in the tissue, P is the octanol:water partition coefficient for the drug, fu is the fraction of the drug unbound in plasma, fNL,P is the fraction of neutral lipids in plasma, fNP,P is the fraction of phospholipids in plasma, and PRT / PRB is the tissue to plasma ratio of the binding protein.
| Ionic State | X | Y |
|---|---|---|
| Acid | \[1 + 10^{pH_{IW}-pK_{a}}\] | \[1 + 10^{pH_{p}-pK_{a}}\] |
| Very Weak Base | \[1 + 10^{pK_{a}-pH_{IW}}\] | \[1 + 10^{pK_{a}-pH_{p}}\] |
| Neutral | 1 | 1 |
A number of these values are drug parameters found in the substance file definitions. However, many of them are organ/compartment dependent as shown in Tables 2 and 3.
| Tissue Compartment | Extracellular Water (fEW) | Intracellular Water (fIW) | Neutral Lipd (fNL) | Neutral Phospholipid (fNP) |
|---|---|---|---|---|
| Adipose (Fat) | 0.135 | 0.017 | 0.853 | 0.0016 |
| Bone | 0.1 | 0.346 | 0.017 | 0.0017 |
| Brain | 0.162 | 0.620 | 0.039 | 0.0015 |
| Gut | 0.282 | 0.475 | 0.038 | 0.0125 |
| Kidney | 0.273 | 0.483 | 0.012 | 0.2420 |
| Liver | 0.161 | 0.573 | 0.014 | 0.2400 |
| Lung | 0.336 | 0.446 | 0.022 | 0.0128 |
| Muscle | 0.118 | 0.630 | 0.010 | 0.0072 |
| Myocardium | 0.320 | 0.456 | 0.014 | 0.0111 |
| Skin | 0.382 | 0.291 | 0.060 | 0.0044 |
| Spleen | 0.207 | 0.579 | 0.0077 | 0.0113 |
| Tissue Compartment | Tissue to Plasma Albumin Ratio | Tissue to Plasma Lipoprotein Ratio |
|---|---|---|
| Adipose (Fat) | 0.049 | 0.068 |
| Bone | 0.100 | 0.050 |
| Brain | 0.048 | 0.041 |
| Gut | 0.158 | 0.0141 |
| Kidney | 0.130 | 0.137 |
| Liver | 0.086 | 0.161 |
| Lung | 0.212 | 0.168 |
| Muscle | 0.064 | 0.059 |
| Myocardium | 0.157 | 0.160 |
| Skin | 0.277 | 0.096 |
| Spleen | 0.097 | 0.207 |
The BioGears implementation of the partition coefficients calculation and all values shown in the tables are derived from the literature [287] [286] [160] [149] [374].
If it is not possible to obtain the information required to compute the partition coefficient for a drug, or if the calculation is not valid for a particular drug for any reason, it is possible to override the computation by directly inputting a constant partition coefficient in the drug file. Note that, to use this functionality, it is best to input a coefficient for every tissue compartment in the model. BioGears currently uses the coefficient-computation override methodology for Albuterol, Ketamine, Morphine, and Sarin. The parameters used to calculate each partition coefficient were found in published data and/or tuned to get the desired kinetic response.
Diffusion
The above partition coefficients are used to calculate the diffusion of a drug across the tissue-vascular barrier. All current drugs in the BioGears Engine use perfusion limited diffusion as found in [160] [149]. For details on perfusion-limited and other diffusion modalities, see the Tissue Methodology.
In the current version of BioGears, all drugs diffuse by the perfusion-limited model described above. An alternative means for modeling drug kinetics would be to leverage the other diffusion methods described in the Tissue Methodology report. The other diffusion models were developed primarily for the transmembrane transport of ions and a few specific organic molecules (e.g. glucose), and they have not been tested for drugs.
Clearance
The PBPK model represents renal, hepatic, and systemic clearance. The renal clearance rate, intrinsic clearance rate, and the systemic clearance rate are specified in the substance file in units of milliliter-blood per second per kilogram. The intrinsic clearance rate is used to calculate the hepatic clearance, as shown in Equation 3.
\[Cl_{H} = \frac{Q_{H}*f_{u}*Cl_{I}*BW}{Q_{H} + f_{u}*Cl_{I}*BW} \]
Where ClH is the hepatic clearance, fu is the fraction of the drug unbound in plasma, ClI is the intrinsic clearance, and BW is the patient body weight.
The amount of drug removed (cleared) from the system is found by calculating the amount of fluid volume that can be cleared by a healthy organ. The volume is calculated, as shown in Equation 4. This process is completed for the renal and hepatic clearance.
\[V_{Cl} = Cl_{H}*BW*dt \]
Where Vcl is the volume cleared, ClH is the organ clearance rate, BW is the body weight, and dt is the time step. The actual mass of the substance removed during this process is found by determining the amount of the drug in the volume cleared, as shown in Equation 5.
\[M_{Cl} = V_{Cl}*C \]
Where MCl is the mass cleared, VCl is the volume cleared, and C is the concentration in the tissue. The systemic clearance represents the total clearance for the body, including the renal and hepatic clearance. Therefore, the total volume cleared is calculated, then the renal and hepatic clearance volumes are removed, as shown in Equation 6. The “remaining” systemic mass cleared is calculated as shown in Equation 5. Half of the mass cleared from renal clearance is removed from each of the kidney tissue compartments, the mass cleared from hepatic clearance is removed from the liver tissue compartment, and the mass removed from the “remaining” systemic clearance is removed from the vena cava compartment. This is assumed to be from various metabolic processes in the plasma.
\[V_{Cl} = \left(Cl_{s}*BW*dt\right) - V_{ClR} - V_{ClH} \]
Where VCl is the remaining systemic volume cleared, ClS is the systemic clearance rate, BW is the patient body weight, dt is the time step, VClR is the renal volume cleared, and VClH is the hepatic volume cleared.
Pharmacodynamics
Pharmacodynamic (PD) models characterize the effect that a drug has on the organism. The current version of BioGears contains two pharmacodynamic models.
- A simple dose-response model with a response biomarker functionally linked to the plasma concentration of a drug via a first order rate constant.
- A site-of-action model with a local response functionally linked to the local tissue concentration of a drug
Effect Site Model
Development of the BioGears pharmaocodynamic model began with a characterization of expected results by subject matter experts for a small library of drugs. The expected results were limited to whole-body biomarkers similar to vital signs (e.g. changes in heart rate, respiration rate, blood pressure, etc.). We treated the expected results as surrogate endpoints and used the common sigmoidal Emax model to characterize the effects. The model was initially calibrated to drug plasma concentration but has been updated to account for delays in equilibration between the concentration in the plasma and at the site-of-action. This was accomplished by introducing a hypothetical "effect site" compartment, transfer to which from the plasma is governed by a drug-specific first order rate constant (ke) [191]. The utility of this strategy is evident when considering a drug such as morphine, which exhibits delays in pharmacological activity due to its slow diffusion across the blood-brain barrier to the central nervous system, where it primarily targets mu-opioid receptors [190]. In the case of drugs for which ke data was not available, the effect site concentration is assumed to be the plasma concentration as before.
In its first iteration, the Emax model referred to the expected effect of the drug rather than the maximum effect of the drug. For that reason, overdose modeling is not possible for most drugs in BioGears. We are working to obtain empirical data from case studies that will allow us to adjust drug response curves to describe non-clinical dose regimes. Currently, only morphine has been completed with satisfactory overdose functionality (see Opioid Intoxication). The pharmacodynamic effects included in the BioGears effect concentration PD model are described in Table 4.
| Pharmacodynamic Effect | Description | Available Values |
|---|---|---|
| Bronchodilation | Drug effect on the bronchii radii. A maximal effect of 1.0 will reverse the constriction of an asthma attack. | 0 to 1 |
| Diastolic Pressure | Change in the diastolic pressure. Given as a fraction. | -1 to 1 |
| Heart Rate | Change in the heart rate. Given as a fraction. | -1 to 1 |
| Hemorrhage Flow | Change in hemorrhage bleeding rate, with negative reducing the effect of hemorrhage. | -1 to 1 |
| Neuromuscular Block | Drug’s strength as a neuromuscular block, with a 1.0 as the strongest block. | 0 to 1 |
| Pupil Size Modifier | Drug effect on the pupil diameter. Given as a modifier. | -1 to 1 |
| Pupil Reactivity Modifier | Drug effect on the pupil reactivity to light. Given as a modifier. | -1 to 1 |
| Respiration Rate | Change in the respiration rate. Given as a fraction. | -1 to 1 |
| Sedation | Drug’s strength as a sedative, with a 1.0 as the strongest sedative. | 0 to 1 |
| Systolic Pressure | Change in the systolic pressure. Given as a fraction. | -1 to 1 |
| Tidal Volume | Change in the tidal volume. Given as a fraction. | -1 to 1 |
| Tubular Permeability | Drug localized effect on tubulear permeability. Given as a severity, 1.0 complete reabsorption block | 0 to 1 |
| Central Nervous Response | Drug depressant effect on receptors in the central nervous system directing chemoreceptor action. Given as a severity with 1.0 being complete suppression | 0 to 1 |
The drug effects are specified for each drug in the substance file. The level of effect is calculated based on the expected effect (or, for some drugs, the maximum effect) of the drug and the current effect site concentration for the drug, as shown in Equation 7 [225] and Equation 8 [293].
\[\frac{dC_{e}}{dt} = k_{e}*(C_{p}-C_{e}) \]
.
\[\Delta E = E_{bl}*\frac{E_{m}*C_{e}^\eta}{EC_{50}^\eta+C_{e}^\eta} \]
According to Equation 7, the rate at which the effect compartment concentration (Ce) equilibrates with the plasma concentration (Cp) is directly proportional to the difference between (Cp) and (Ce) and a first order rate constant, ke. Note that it is assumed that the rates of influx to and efflux from the effect compartment are equivalent. (Ce) is utilized in Equation 8, where Em is the expected (or maximum) effect of the drug, EC50 is the concentration at 50% of the effect, Ebl is the baseline for that effect (i.e., heart rate baseline), ΔE is the calculated effect of the drug, and η is the slope factor [293]. This procedure is repeated for each of the effects in Table 4.
The drug effect is applied as a fraction of the baseline for the biomarker, which is a patient variable in BioGears. For example, a person with a resting heart rate of 72 bpm may have a physiological process happening during simulation, perhaps as a condition, which increases his/her baseline heart rate to 80 bpm. If this patient is given a drug with a heart rate effect of 0.2, then at maximum the patient's heart rate will be 96 bpm (80 + 0.2 * 80). If the same drug were given to the same patient but without the condition, the maximum heart rate will be 86.4 bpm (72 + 0.2 * 72).
The EC50 values which could not be inferred from literature were estimated from the maximum concentration of the drug at a standard adult dose, as shown in Equation 9.
\[EC_{50} = \frac{C_{max}}{32} \]
Where Cmax is the maximum plasma concentration for the standard adult dose and EC50 is the concentration at which 50% of the effect should be present.
Drug-Drug Interactions
Drugs can be administered in combination in BioGears. However, in most cases the interaction will modeled only by stacking the pharmacodynamic modifiers associated with each drug. Such an approach is appropriate in very limited circumstances. We currently have two reversal agents whose interactions with their targets are modeled in greater detail: Pralidoxime–an organophosphate antagonist (see Sarin Model)–and naloxone, which opposes opioids such as Morphine and Fentanyl. Naloxone is an interesting case because it exerts virtually no pharmacodynamic effects on its own; it operates solely by competitively binding with opioids for mu receptors in the central nervous system [122]. The impact of competitive antagonists on the effect of an agonist such as an opioid can be modeled by Equation 10 [44].
\[\Delta E = E_{bl}*\frac{E_{m}*C_{e}^\eta}{EC_{50}^\eta*(1+\frac{C_I}{K_I})^\eta+C_{e}^\eta}\]
The parameters Ebl, Em, Ce, and EC50 are defined as previously with respect to the agonist. KI captures the tendency of the antagonist to displace the agonist from the shared target receptor (lower implies greater potency). Conveniently, when no antagonist is present, Equation 10 reduces to Equation 8, allowing it to be implemented with minimal additional modeling effort. Naloxone reversal of opiod induced respiratory depression is currently the only competitive antagonism scenario modeled in this way (see Reversal of Opioid Induced Respiratory Depression). We are working to incorporate partial and non-competitive antagonism, which will allow us to describe increasingly complex interactions.
Cardiovascular Effects
Equation 8 provides a straightforward calculation for the heart rate. However, to be applied in the cardiovascular system, the drug effects need to be translated to the effects on the mean arterial pressure and the pulse pressure. This is accomplished using Equations 11 and 12. These equations were developed using the relationship between diastolic and systolic pressure and the mean arterial pressure [134].
\[\Delta MAP = \left(2* \Delta DBP \right) + \frac{\Delta SBP}{3} \]
\[\Delta P_{pulse} = \Delta SBP - \Delta DBP \]
Where MAP is the mean arterial blood pressure, DBP is the diastolic blood pressure, and SBP is the systolic blood pressure. These changes to the heart rate, mean arterial pressure, and pulse pressure are then system outputs for the drug system. The changes are then applied in the Cardiovascular System. For more details on the implementation of the effects see the Cardiovascular Methodology.
Respiratory Effects
As with the Cardiovascular System, the respiratory and tidal volume effects are relatively straight forward to apply. The neuromuscular block and sedation levels are calculated to have an effect level between zero and one, where zero is no effect and one is a maximal effect. The detail of how these are implemented can be found in the Respiratory Methodology.
Site-of-Action Models
There are currently three drugs which utilize a localized PD effects model: Albuterol, Furosemide, and Sarin.
Respiratory Effects
Aerosolized substances have a direct effect on the respiratory system. There are two direct-effect aerosol substance properties.
- BronchioleModifier
- A parameter which controls the dilation (positive value) or constriction (negative value) of the bronchioles in the presence of the substance
- InflammationCoefficient
- A parameter to quantify the propensity of the aerosol to cause inflammation of the respiratory tissues
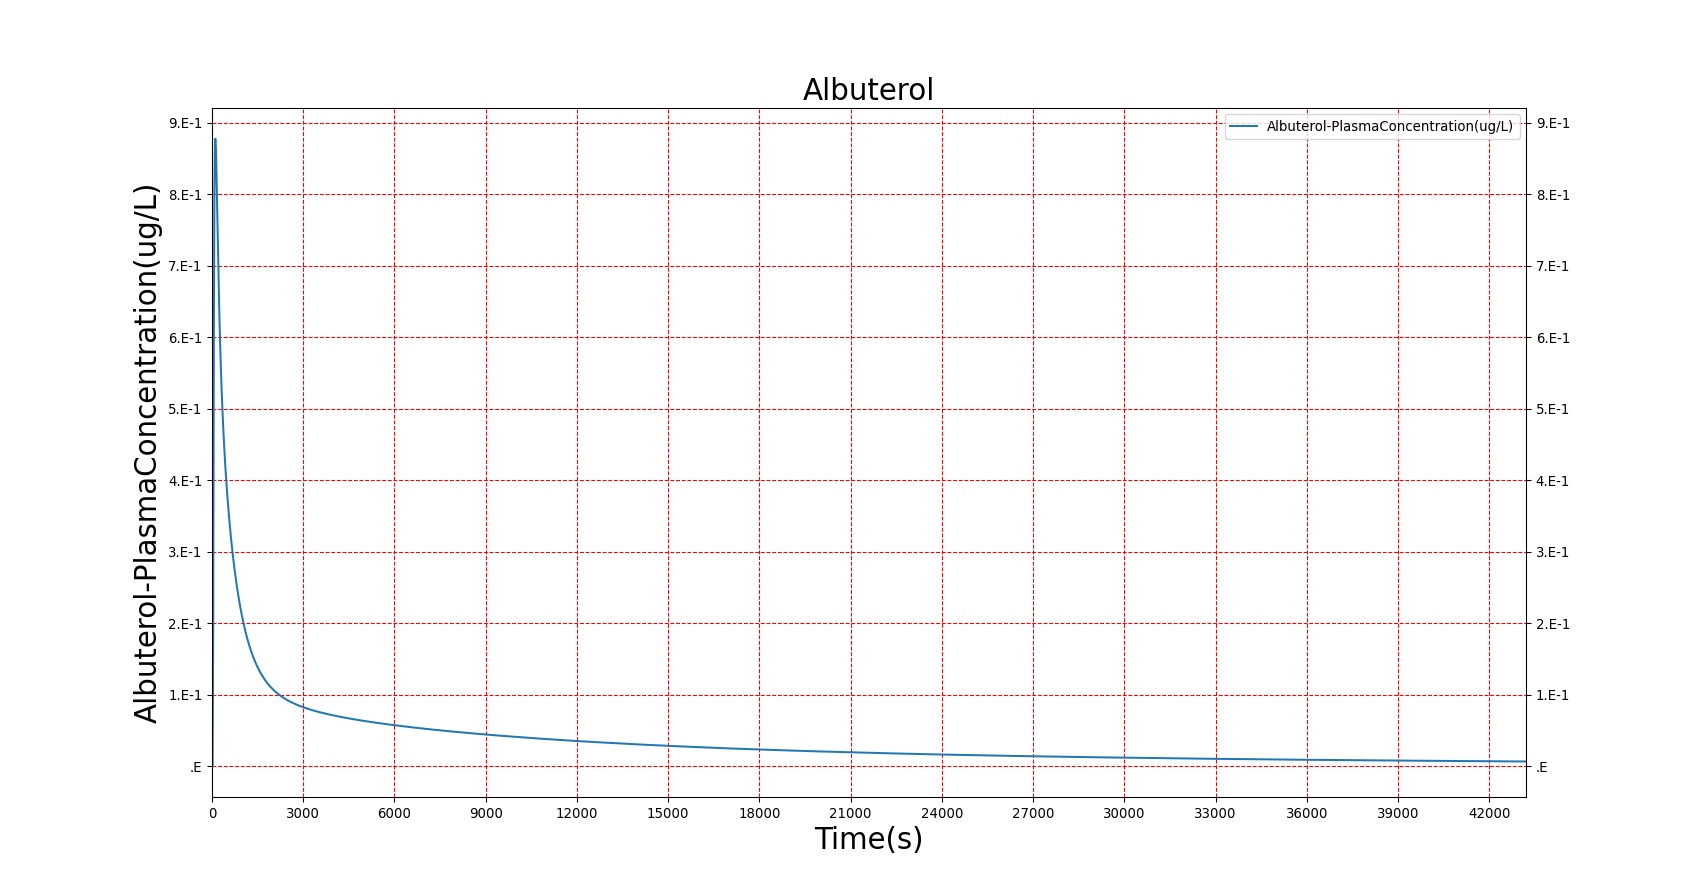
For example, Albuterol is an aerosolized drug that typically enters the body via nebulizer or metered-dose inhaler. Accordingly, in BioGears Albuterol enters the body through the respiratory tract and diffuses into the respiratory tissues (see the Aerosol Section in the Environment Methodology report). The BronchioleModifier for Albuterol is set to 1 in the substance file, meaning that Albuterol has the capability to maximally dilate the bronchioles. The bronchodilatory effects of Albuterol are applied directly at the site of action, and the actual bronchodilation is a function of the concentration of Albuterol in the respiratory tissues. The nerve agent Sarin has the opposite effect of Albuterol, inducing severe bronchoconstriction. As such, the BronchioleModifier for Sarin is set to a negative value. See the Nerve Agent: Sarin section for more details.
Renal Effects
The pharmacodynamic effects of diuretics locally target the renal system's functionality. Local binding of the Na-K-2Cl symporter by Furosemide (Lasix) in the tubular lumen stimulates an increase in urine production and ion excretion. In BioGears we simulate this effect by adjusting the reabsorption permeability as a function of plasma concentration of Furosemide. This enables simulation of the whole-body drug effects, but the model does not use the local concentration of drug in the tubular lumen as the primary determinant of the reabsorption adjustment. A mechanistic model based on traditional receptor theory which combines the tissue properties of receptor concentration and signal transduction with the drug properties of intrinsic efficacy and affinity to form a model of drug response would use the local tissue concentration as the first link in a causal chain leading to permeability changes and the appropriate downstream effects. This type of mechanistic model is recommended as future work. For details on the reabsorption and urine production of the renal system, see the Renal Methodology report. The results of the Lasix administration simulation are compared to data found in literature and presented in the validation section.
Substances
The full list of drugs available in the BioGears library can be found in Table 5 in the Validation section. Additional substances, such as oxygen, carbon dioxide, and hemoglobin that are available in the BioGears Engine can be found in the Blood Chemistry Methodology.
Compounds
BioGears compounds allow a user to administer a specific combination of substances (see above) at the same time. In most cases, compounds (or solutions) used in BioGears can be represented by their ionic components.c Currently, BioGears supports the following compounds:
- Piperacillin TazobactamL A combination of piperacillin, tazobactam, and sodium.
- Plasma: Plasma contains components similar to whole blood but without any blood cells. The plasma compound contains sodium, albumin, urea, glucose, triacylglycerol, calcium, creatinine, chloride, and potassium.
- Plasma Lyte A: A buffered solution made up of sodium, potassium, magnesium, chloride, acetoacetate, and glucose.
- Ringers Lactate: A sodium lactate solution consisting of sodium, chloride, lactate, potassium, calcium, oxygen, carbon dioxide.
- Saline: A combination of sodium, chloride, oxygen, and carbon dioxide.
- Whole Blood: BioGears supports all eight primary blood types (A, B, AB, and O each either Rh positive or negative). Each whole blood compound contains hemoglobin, oxyhemoglobin, oxygen, carbon dioxide, sodium, albumin, urea, glucose, triacylglycerol, calcium, creatinine, chloride, potassium, red blood cells, white blood cells, platelets, and the appropriate antigens corresponding to blood type.
Patient Variability
It is possible to customize the body that is simulated by BioGears. For a detailed discussion of patient variability in BioGears please see the Patient Methodology report. Variability in body morphology will obviously have an effect on the pharmacokinetics of a drug. For example, a larger body may have a larger plasma volume, and thus the plasma concentration for a specific dose of a drug will be less than the same dose administered to a smaller body. Additionally, the partitioning of drugs is dependent on the relative masses of the physiological compartments, and storage is affected by distribution. Lipophilic drugs may appear to remain longer in the BioGears plasma in patients who are configured with a higher body fat fraction. Patient configuration will also impact the pharmacodynamics. Maximum drug effects are computed as a fraction of baseline physiology. Changing a patient's baseline parameter (e.g. heart rate baseline) will also change the maximum effect (e.g. maximum heart rate) at a specific concentration of a drug. All drug validation is performed on a BioGears Standard Male.
Dependencies
The substance calculations rely on the flow values calculated by the Circuit Methodology to calculate the movement of substances from compartment to compartment in each circuit. Any limitations and assumptions associated with this methodology will also be associated with the Drugs Methodology. The pharmocokinetic modeling is reliant on accurate values for the physical chemical properties of drugs. If these parameters are unknown or estimated from animal studies, the calculation for the partition coefficient may become unreliable. For some drugs, this information may be difficult to determine. The BioGears model also allows the user to supply partition coefficients directly. Some third party resources, both open source and commercially available, may provide this data for users, allowing incorporation of the data into the BioGears full body simulation.
While this model is primarily used for drugs, it could be used for any substance in the body. BioGears uses the clearance methodology for several additional substances. The modular approach to these calculations allows for the use of any combination of the three methodologies, PK, clearance, and PD.
The substance values and calculations are used by a variety of systems to trigger actions and responses, define physiologic set points, scale circuit parameters, and modify driver frequencies. Many of these triggers and responses are discussed in the Blood Chemistry Methodology and the Endocrine Methodology. The drug-specific effects are listed and described briefly in Table 5. The implementation of these calculated responses can be found in the Cardiovascular Methodology and the Respiratory Methodology.
Assumptions and Limitations
The Drugs Methodology is based on the assumption that all substances are suspended in the fluid (blood or air, depending on the system) and move through the circuits with the flow. While this does allow for renal and hepatic clearance and metabolic elimination of substances, it does not allow for particle deposition. This assumption is valid for the level of fidelity of the model. In the future, particle deposition can be addressed by adding a more detailed substance methodology with factors for deposition within an organ, tissue, or blood vessel. Also, not included is a method for modeling vaporized substances, such as albuterol. In the future, we will add this methodology to allow a liquid in the respiratory tract and produce a more realistic representation of the behavior.
The drug model addresses many of the earlier limitation of the BioGears drug model. This includes creating a substance file that uses physiochemical properties to define the pharmacokinetic properties and intuitive modifiers to calculate the pharmacodynamic effects. However, this implementation of a PD model works best with a drug with immediate effects, such as anesthesia medications. This implementation has not been tested for drugs with a later onset due to secondary mechanisms. This is an area for future work. Additionally, no drug interactions or intoxication is modeled.
Actions
Interventions
Bolus Administration
A bolus administration represents an injection of a substance in a single dose. The substance, concentration, and amount are specified by the user. The total mass for the dose is calculated by multiplying the concentration and the amount. The total mass is then incrementally added to the vena cava compartment over the course of two seconds to represent the slow depression of a plunger. Once added to the vena cava, the substance will circulate through the Cardiovascular System as part of the blood flow. The effects of the substance on the physiologic output will vary with the substance.
IV Administration
Intravenous administration represents administration of a compound substance (a single entity with multiple substances, i.e., saline) at a specified rate over time into the venous system. The compound substance, the rate, and the bag volume are specified by the user. At each time step, the mass of the substances are incremented based on the amount of compound substance entering the system. The mass is calculated by taking the flow entering the system at each time step multiplied by the known concentration of each substance within the compound substance. This mass is then added to the vena cava at each time step until the intravenous administration is stopped. The added substances will then circulate through the Cardiovascular System as part of the blood flow. The effect on the physiologic output will vary based on the compound substance selected.
IV Infusion
Titration represents the administration of a single substance at a specified rate and concentration over time into the venous system. The user selects a single substance and specifies the concentration and rate with titration. As with intravenous administration, the mass of the substance is incremented based on the amount of the substance entering the system. The mass is calculated by taking the flow entering the system at each time step multiplied by the known concentration of each substance within the compound substance. This mass is then added to the vena cava at each time step until the intravenous administration is stopped. The added substances then circulate through the Cardiovascular System as part of the blood flow. The effect on the physiologic output will vary based on the compound substance selected.
Oral (Gastrointestinal)
Drugs administered orally are transported to the bloodstream via an advanced compartment and transit (ACAT) model. Examples of ACAT models with varying numbers of compartments are plentiful in the literature; the BioGears implementation follows the work of [406] and [7]. The gastrointestinal track is divided into nine regions in which both solid and dissolved drug concentrations are tracked: Stomach, Duodenum, Jejunum 1, Jejunum 2, Ileum 1, Ileum 2, Ileum 3, Cecum, and Ascending Colon. The rate of mass transit between compartments is governed by first order rate constants defined in [406], while the rate of drug dissolution within each compartment is determined by the Noyes-Whitney equation [406]. Every compartment except the stomach exchanges dissolved drug mass via permeation with an enterocyte layer from which drug is deposited in the portal vein. The rate of permeation from each region depends on the local pH and drug-specific parameters (LogP, pKa, molecular weight, polar surface area, number of hydrogen bonds) as outlined in [399].
Oral (Transmucosal)
BioGears has develeloped a specialized model for administration of oral transmucosal fentanyl citrate (OTFC). Fentanyl is deposited as a solid in the mouth and its rate of dissolution is calculated via the Noyes-Whiney equation. Dissolved fentanyl diffuses through the oral mucosal layer into the systemic circulation. We solve the diffusion equation by discretizing the oral mucosal barrier into thin layers and applying a central finite difference strategy. The physical properties of the mucosal layer (surface area, thickness) were obtained from [404] [414] [309]. A large fraction of the dissolved fentanyl is swallowed and enters the stomach compartment of the ACAT model described above, after which it is subjected to first-pass metabolism. In this way, approxiamtely 50% of the fentanyl reaches the systemic circulation, which is in line with observations in pharmacokinetic studies [346] [341].
Results and Conclusions
Validation - Resting Physiologic State
The Drugs Methodology has no resting state validation.
Validation - Actions
Bolus Administration
All drugs in the BioGears library were validated qualitatively or with subject matter expert input. The bolus injection methodology was validated by comparing the PK and PD results to literature. See the sections below for more detail.
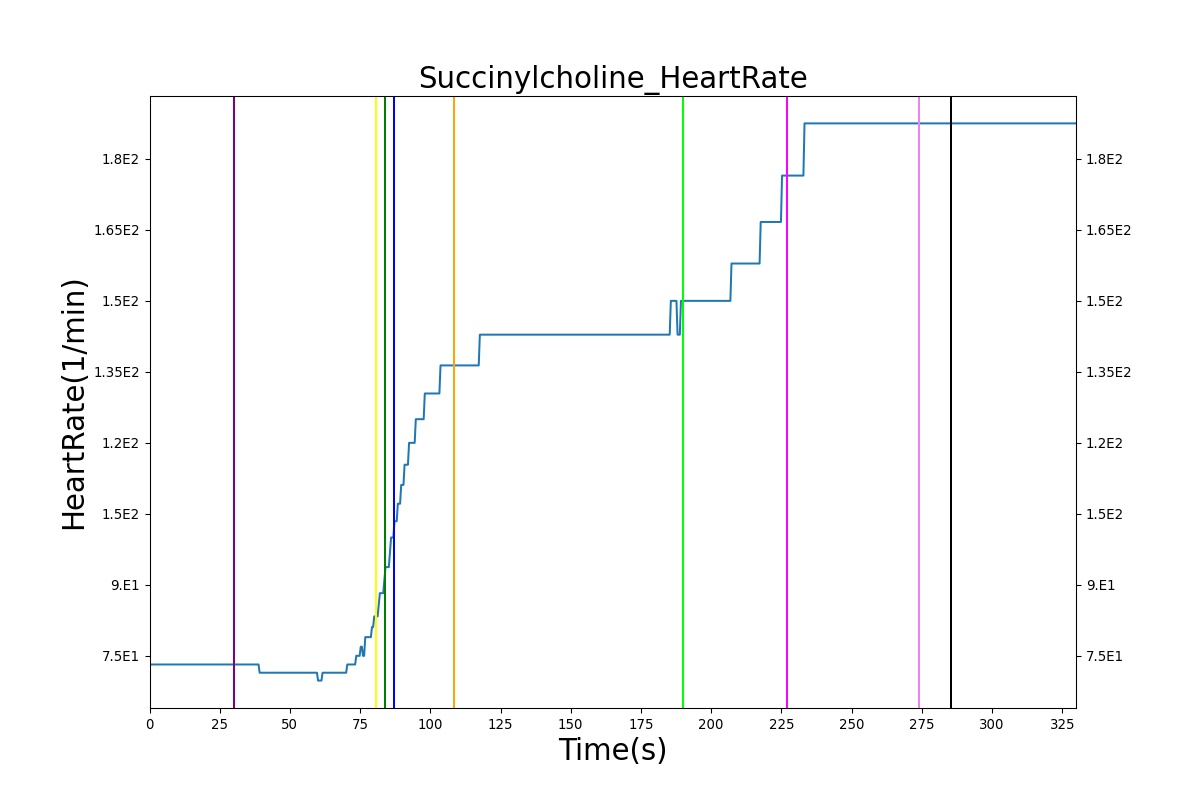
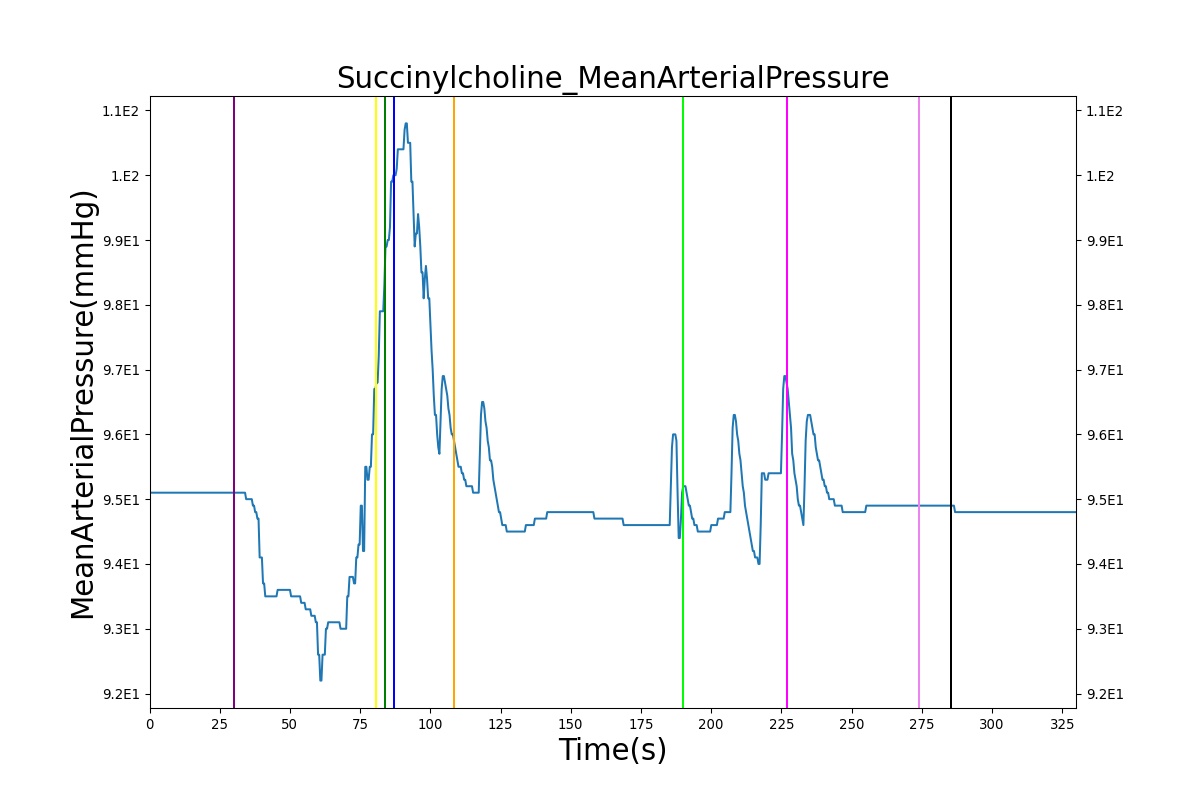
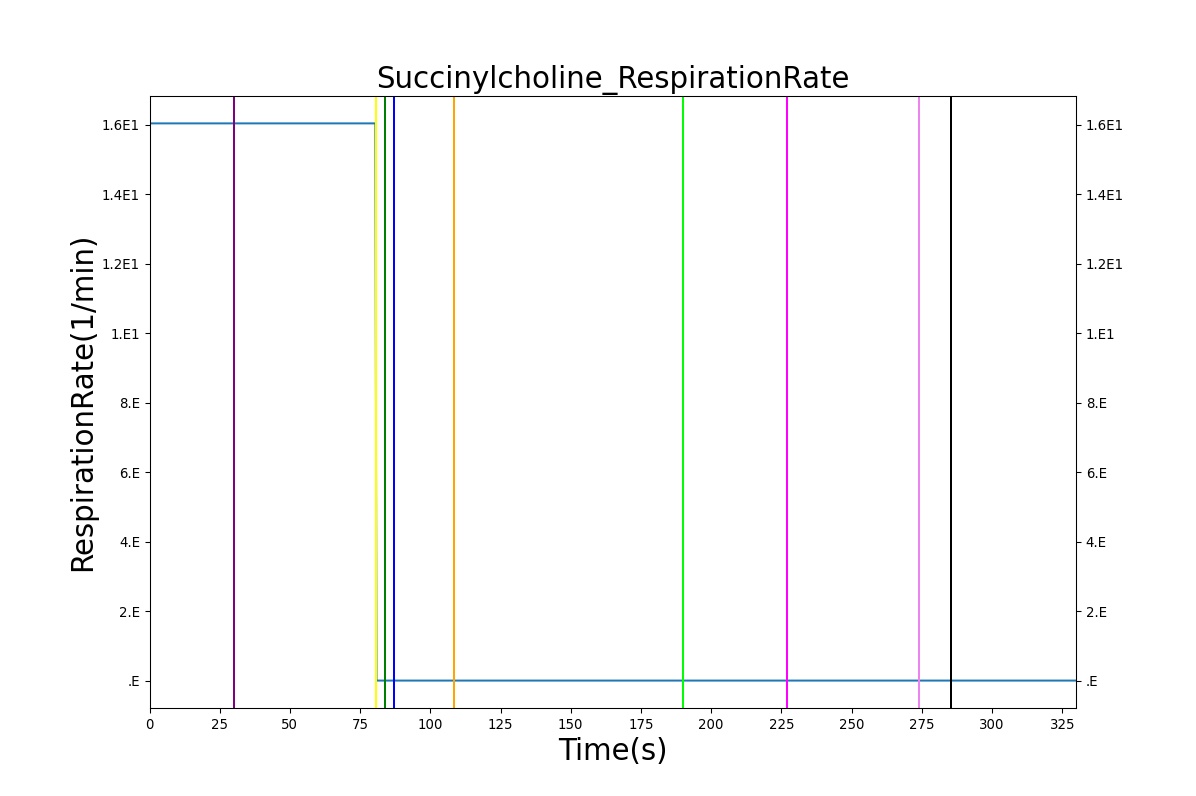
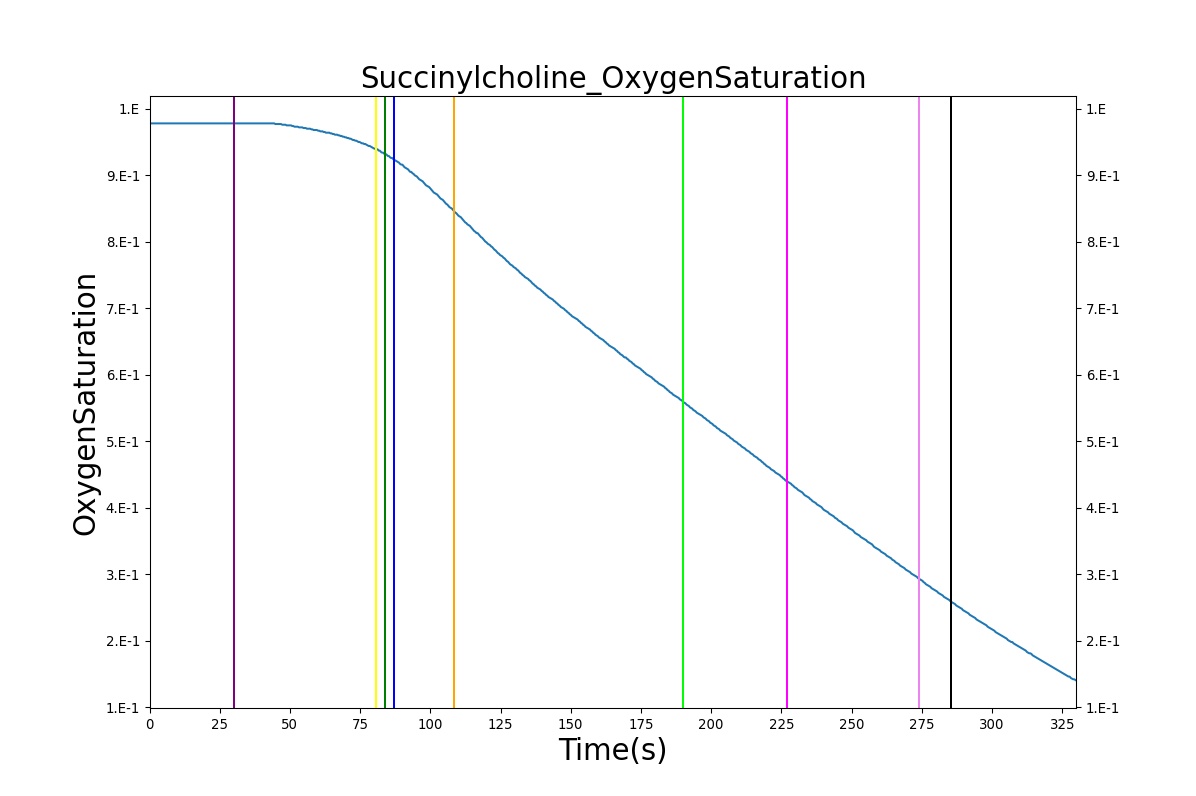
The Succinylcholine scenario shows a drug impacting the major BioGears systems. Succinylcholine (Figure 2) initially drops the heart rate and blood pressure approximately 5–10%. As expected, the respiration drops to zero within 60–90 seconds to represent the paralysis associated with the neuromuscular blocker. The oxygen saturation drops slowly as the concentration of oxygen in the bloodstream drops, leading to hypoxia. Epinephrine is released in response to hypoxia, causing an increase in heart rate and blood pressure (Endocrine Methodology). This is an example of the interdependent nature of the BioGears systems and the chain reaction drug administration can cause.
| 
|
| 
|
| |
Intravenous Administration
Validation of intravenous administration of a hypotonic solution and blood products can be found in the Cardiovascular Methodology.
Validation - Pharmacokinetic
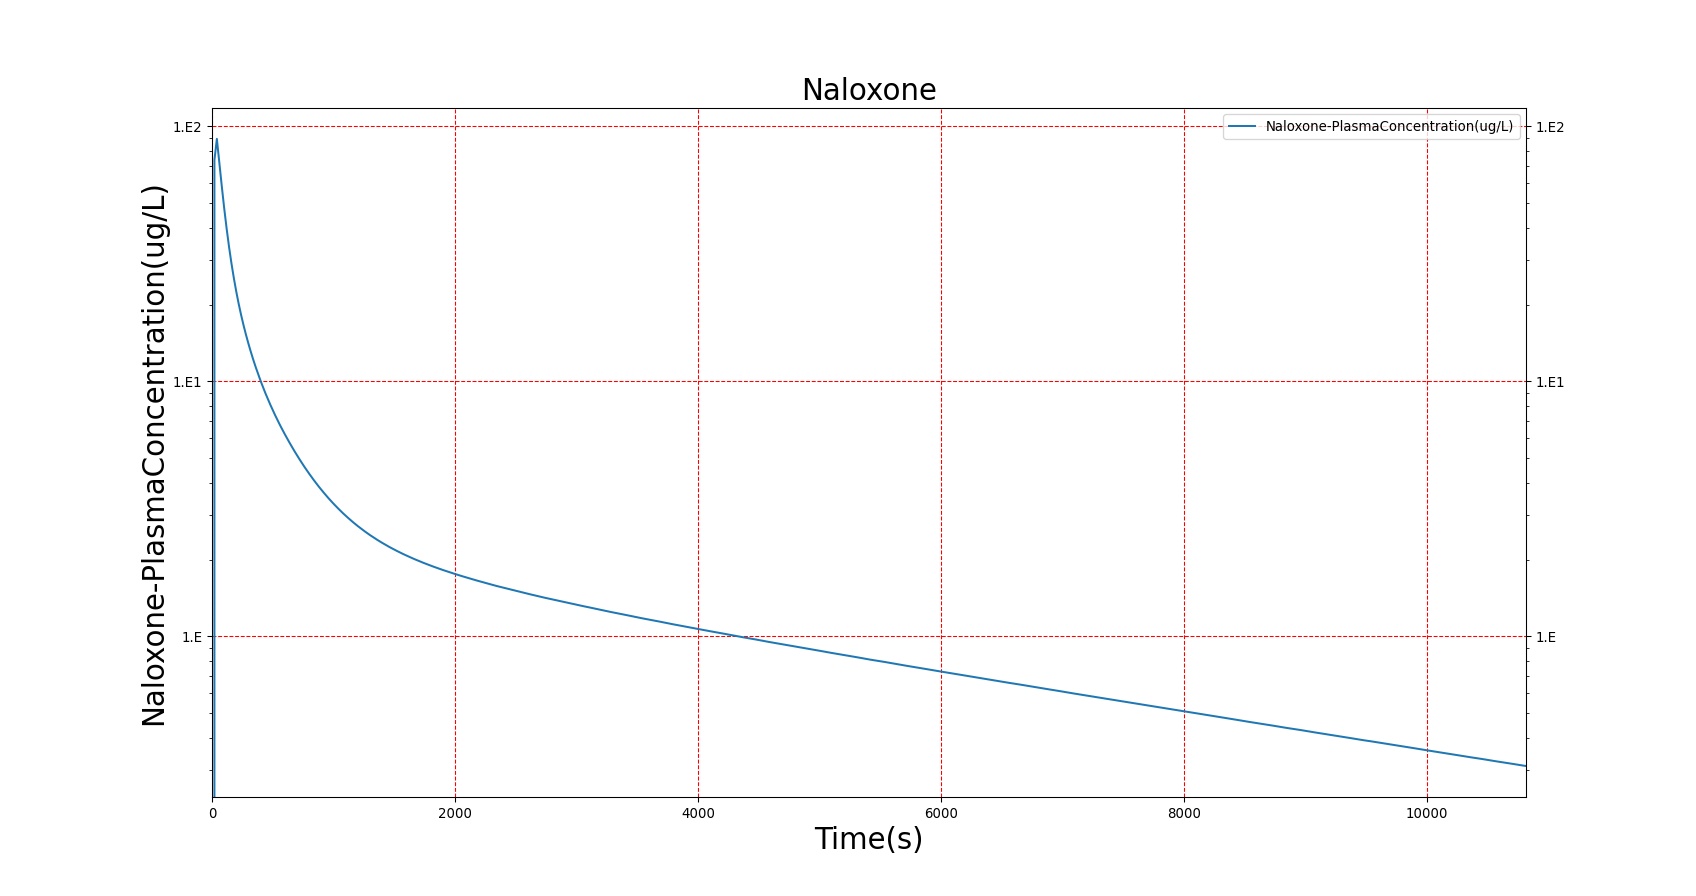
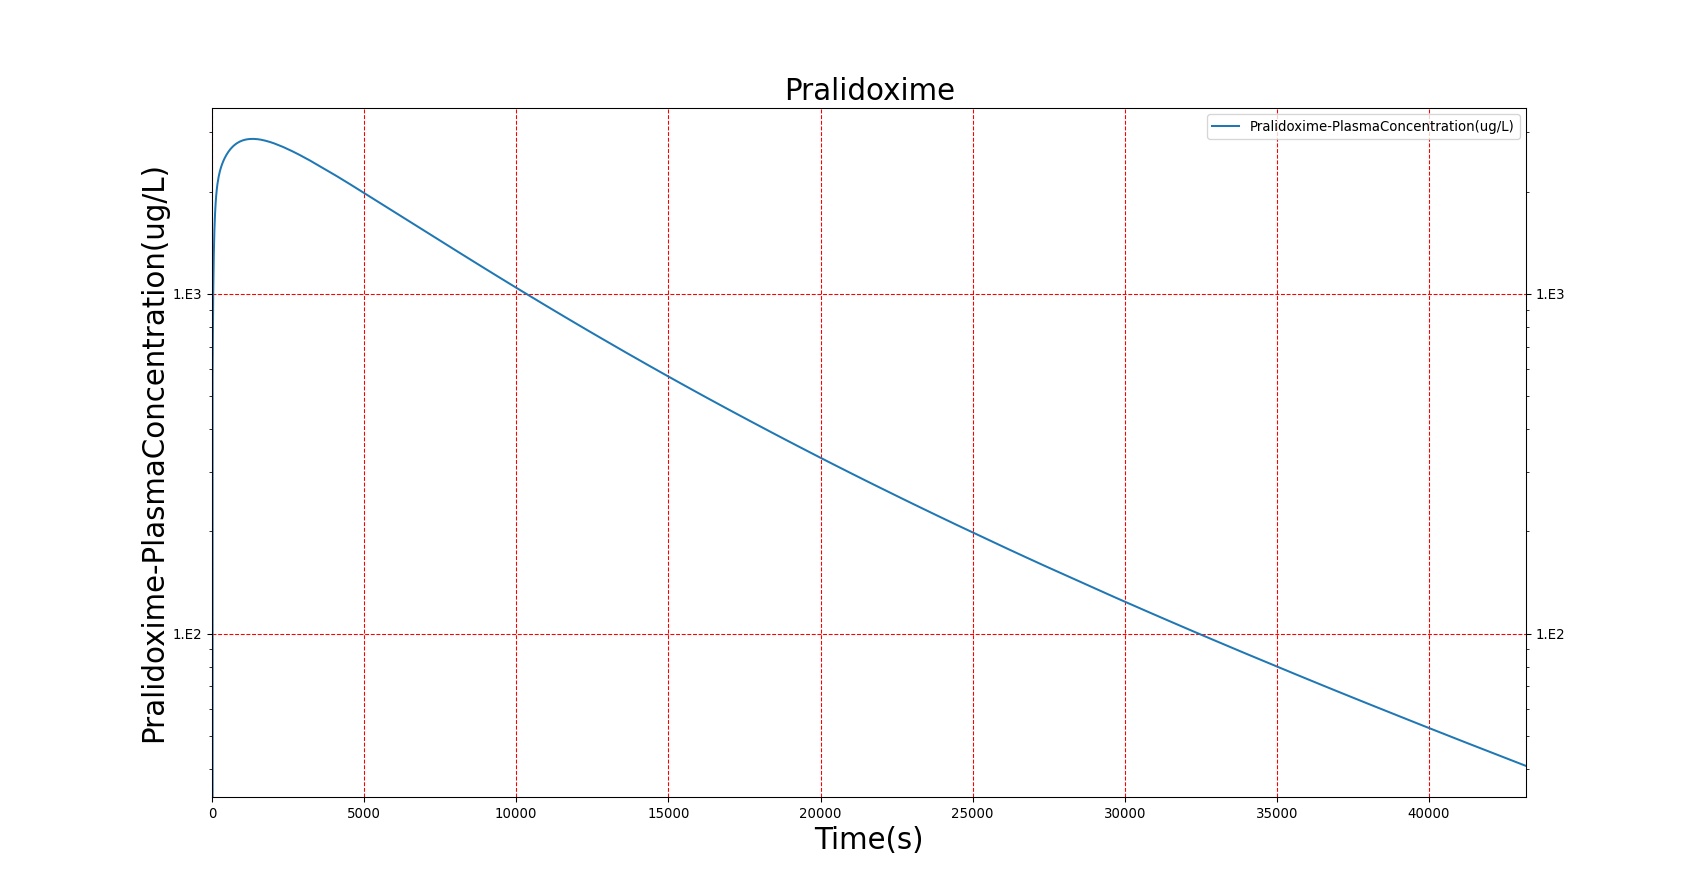
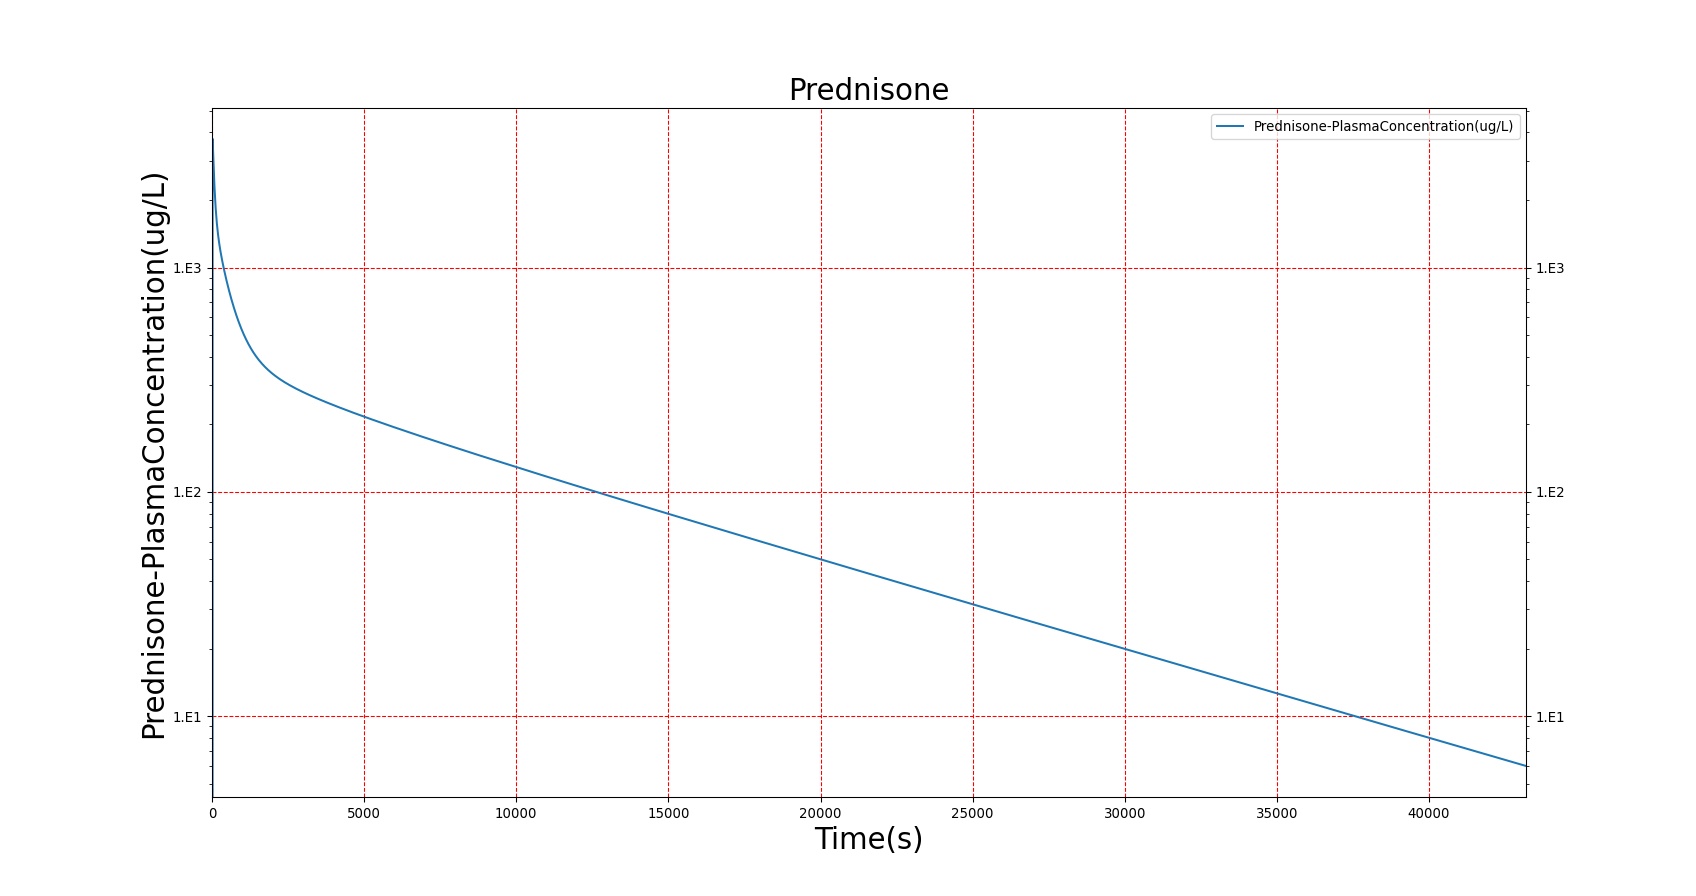
The PK model was validated by comparing the plasma concentration calculated by the BioGears Engine to plasma concentration curves found in the literature. The comparisons are shown in Figures 3–17. No available data was found for Epinephrine, so this drug was only validated from a PD perspective.
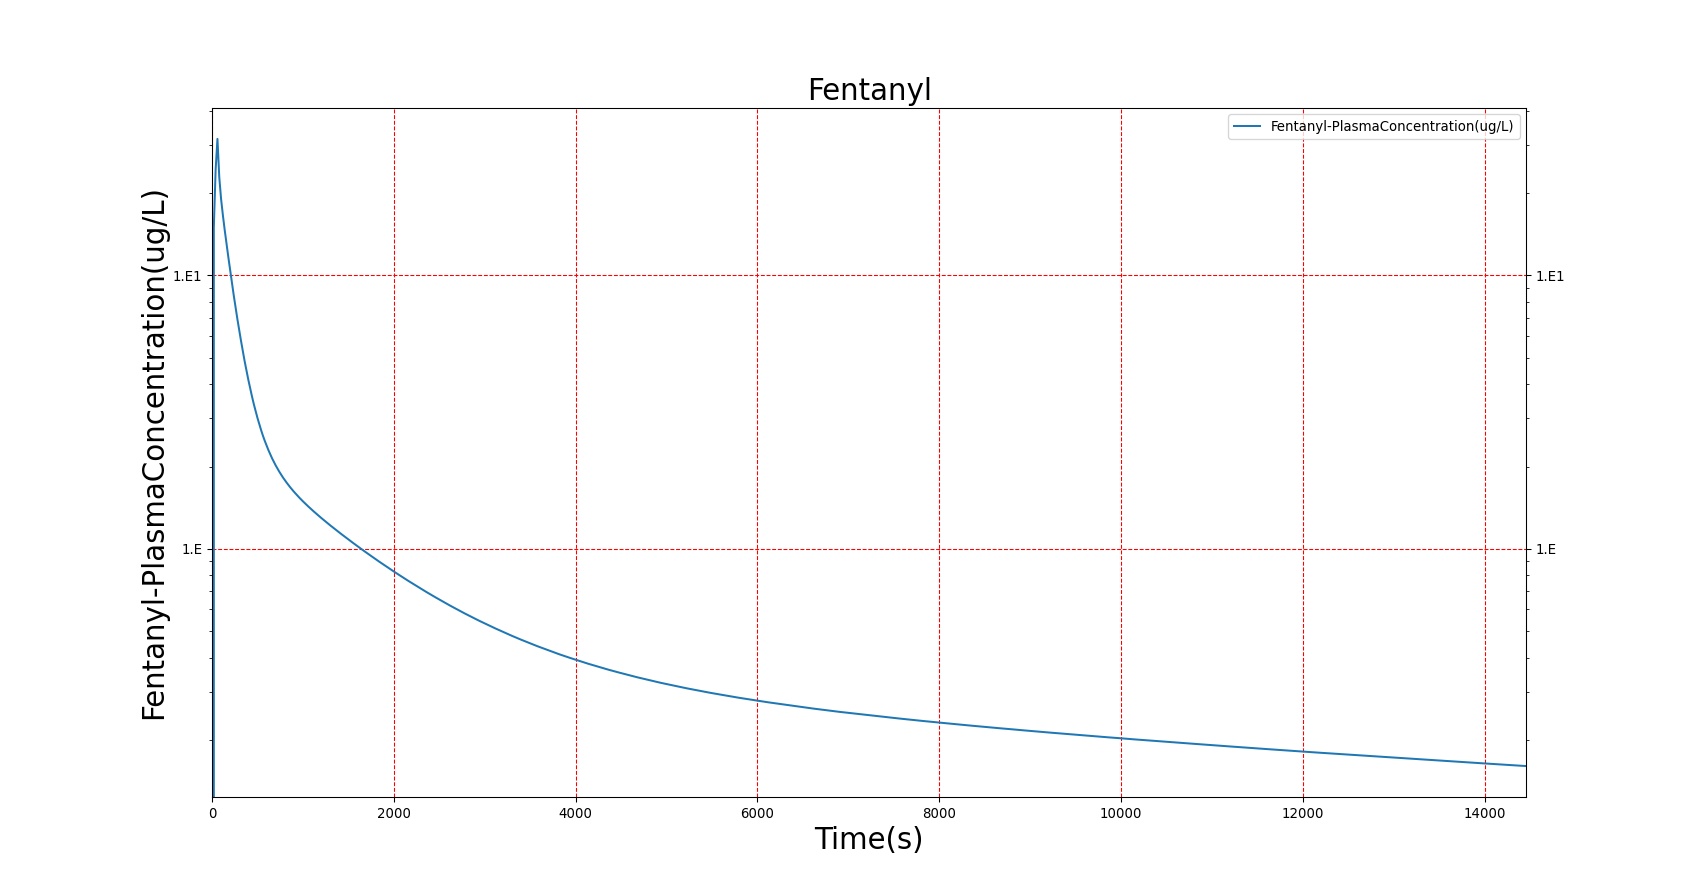
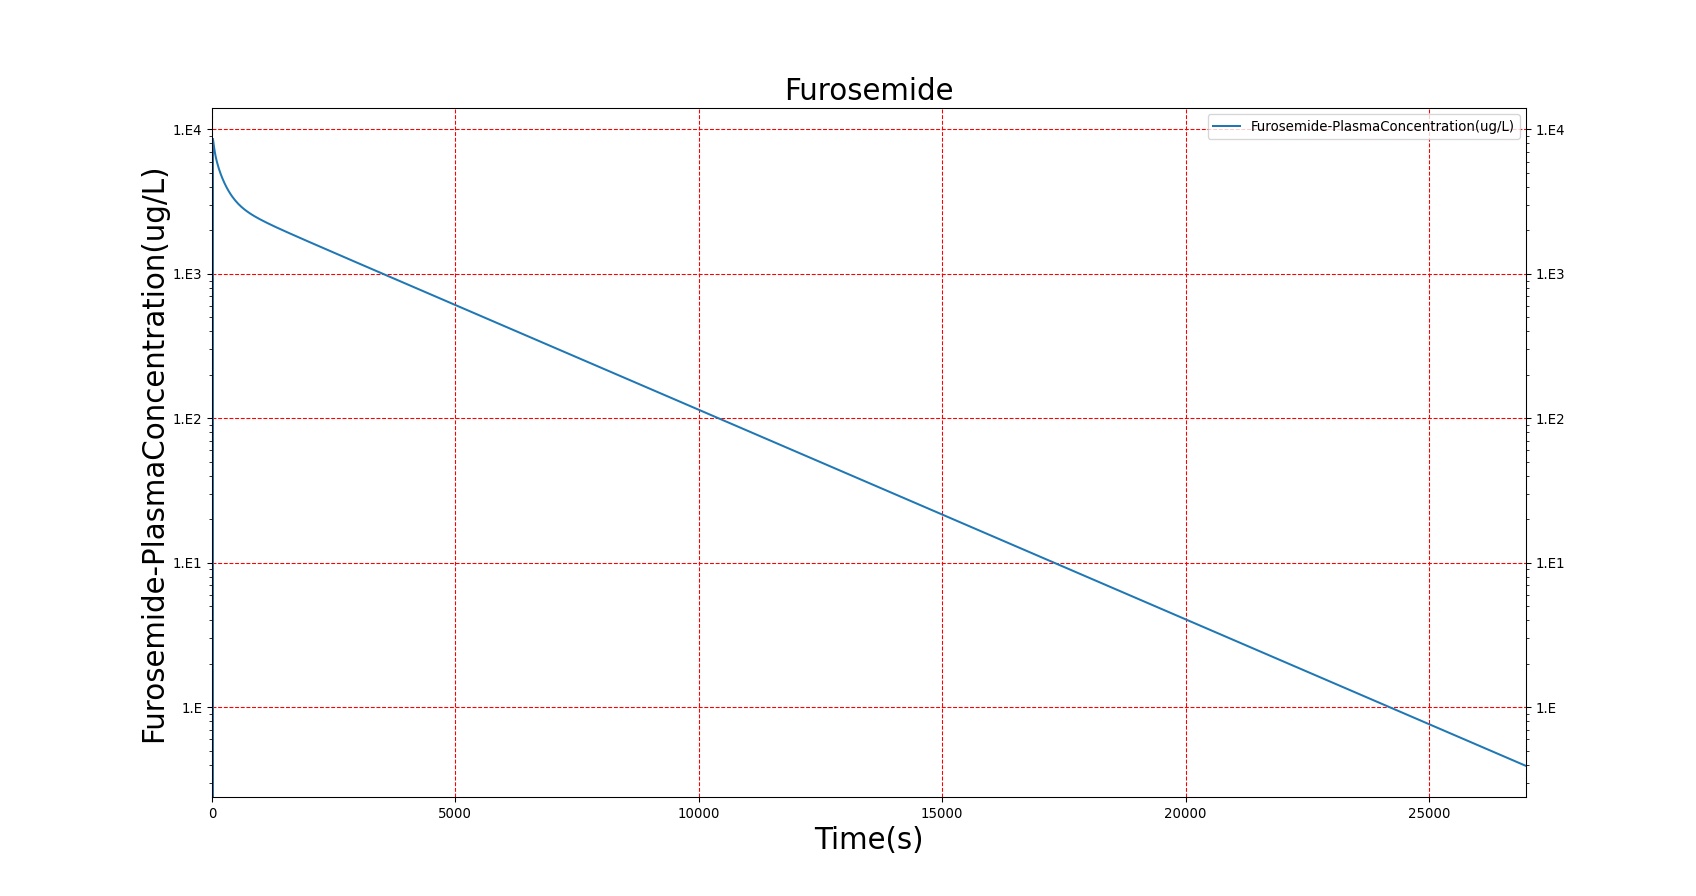
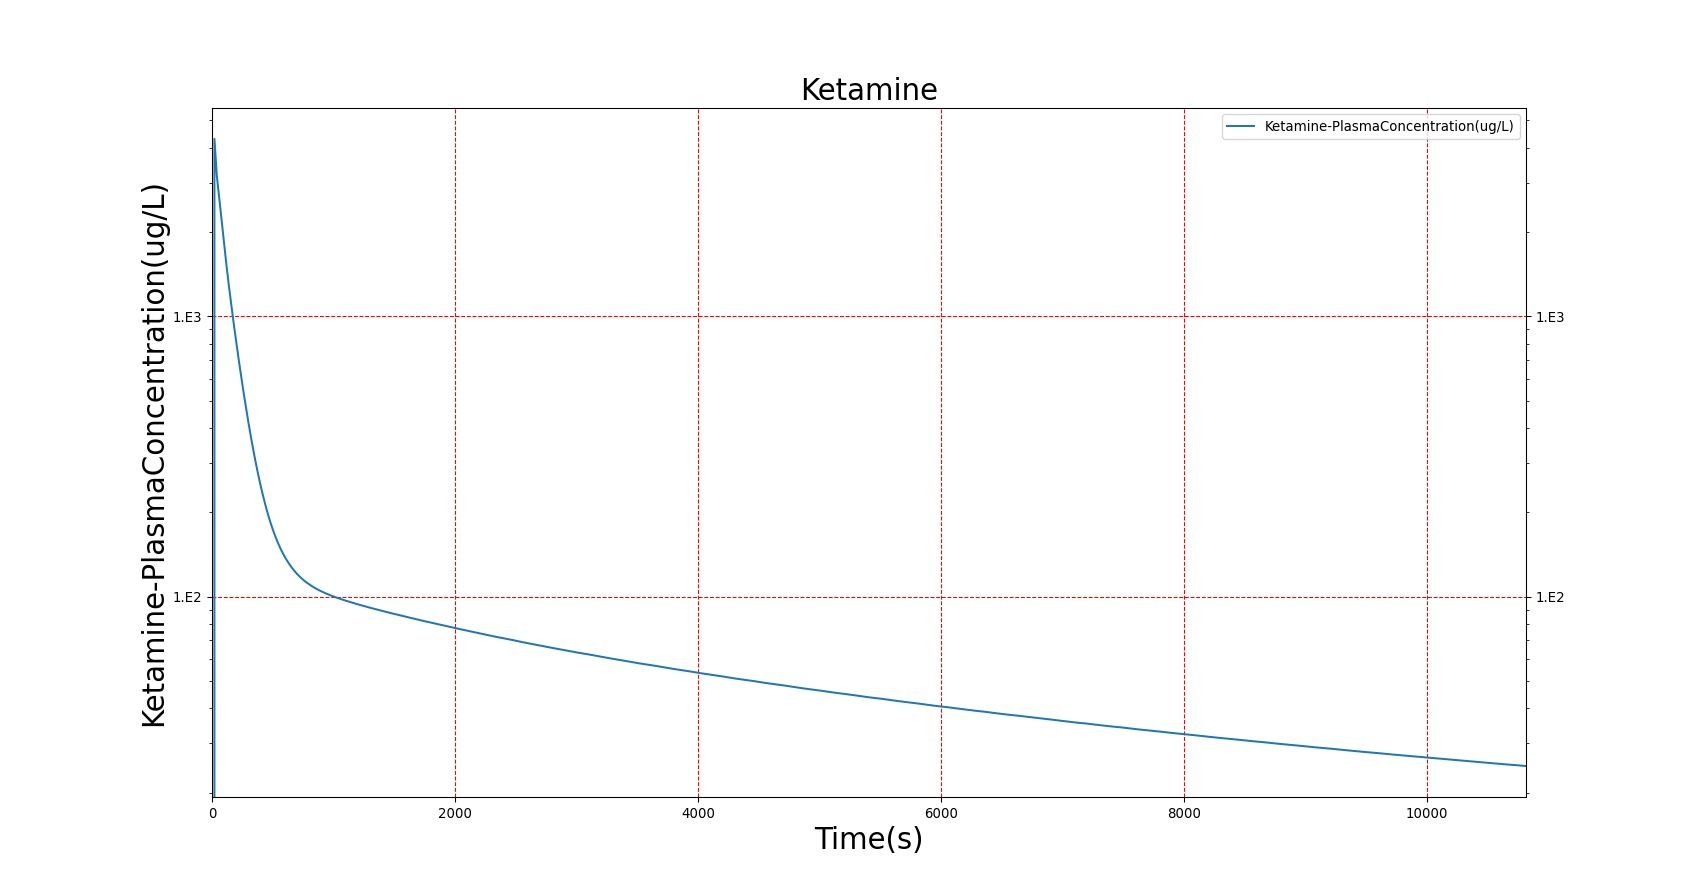
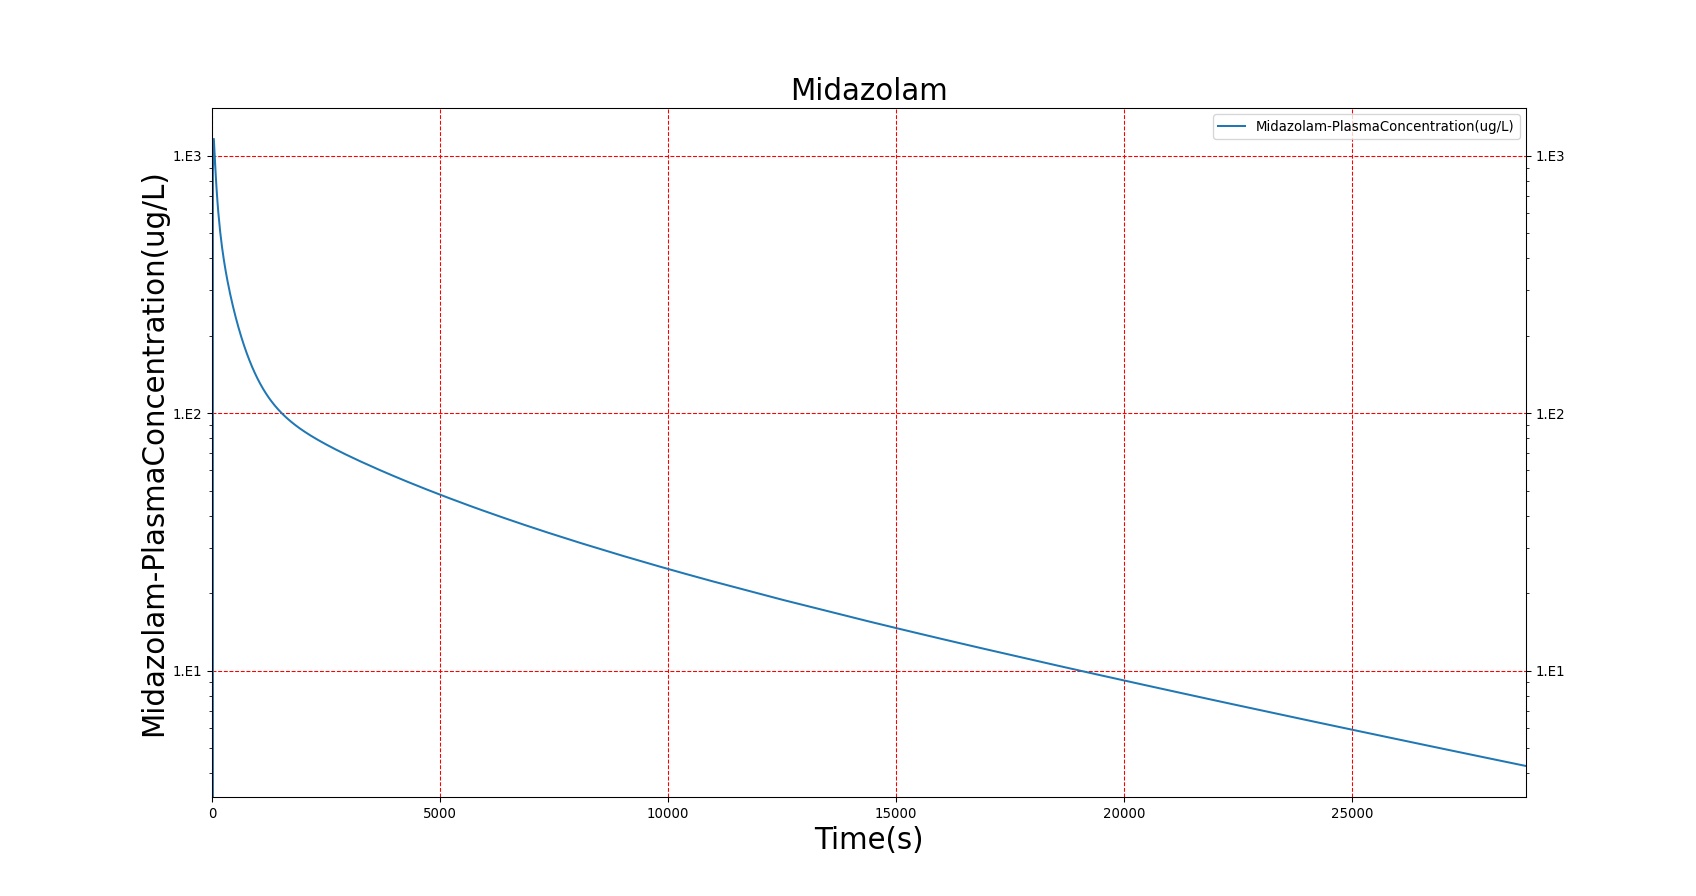
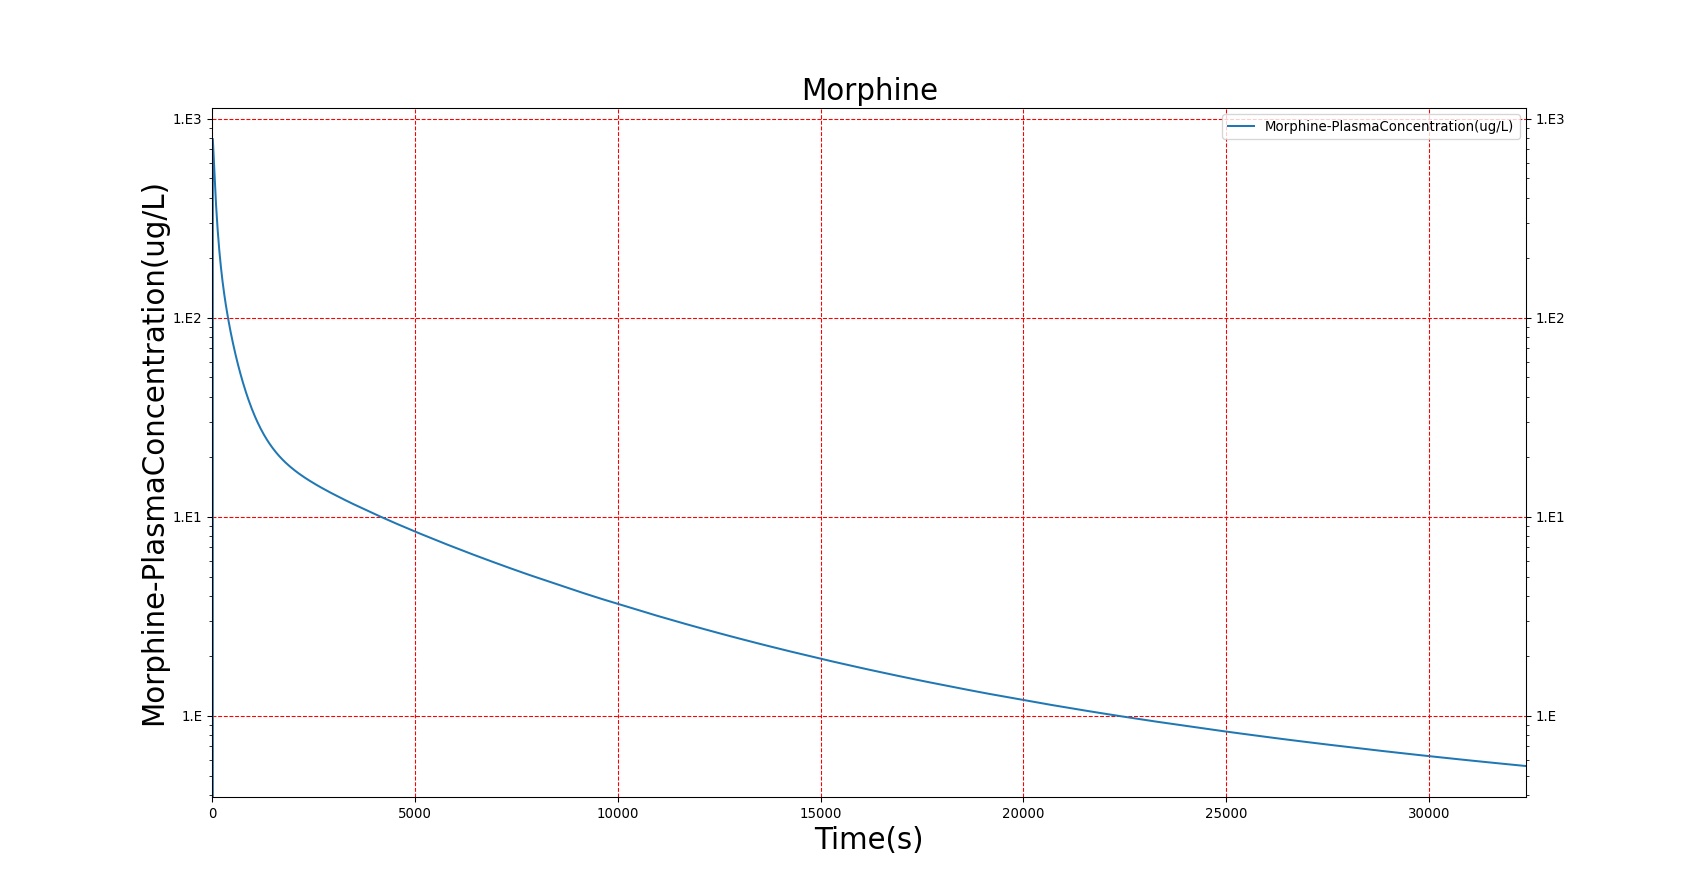
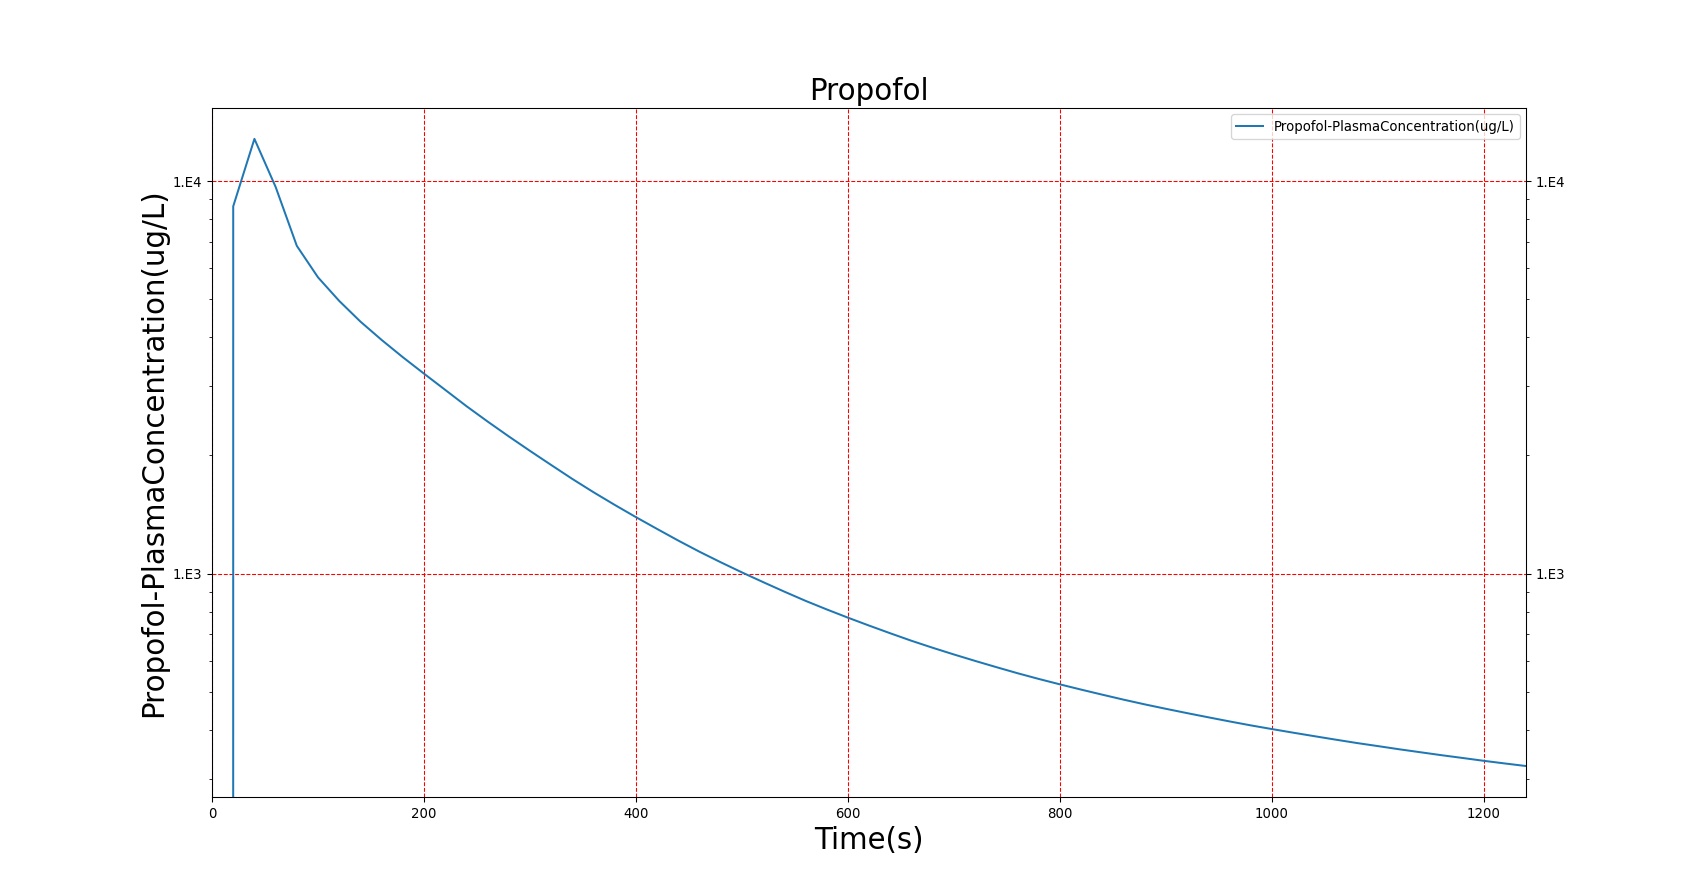
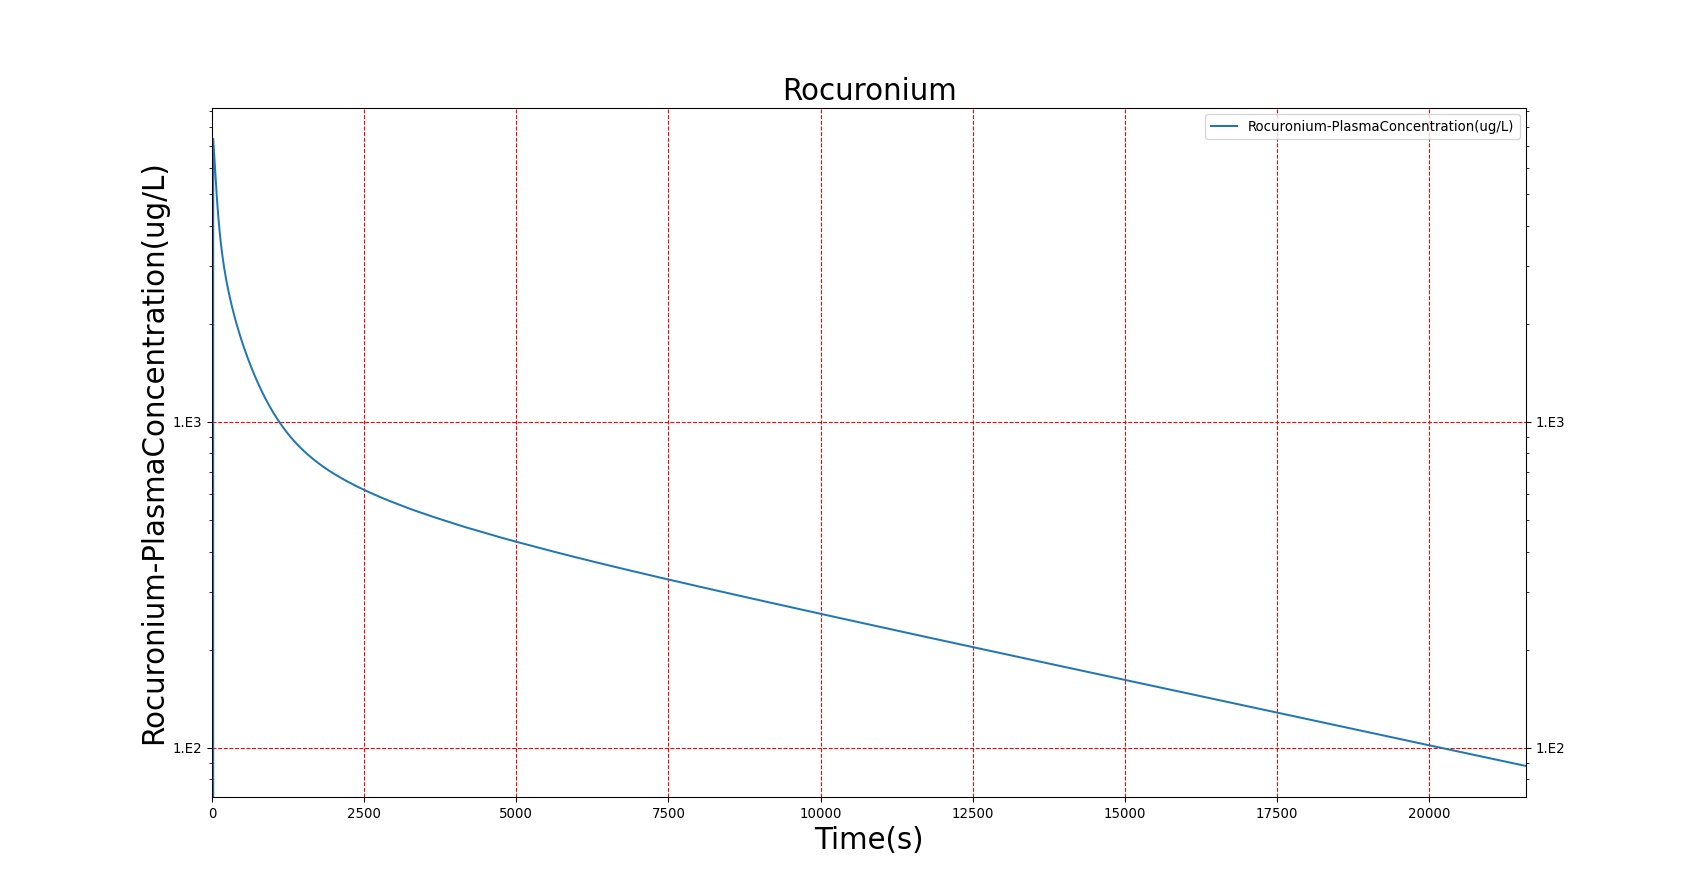
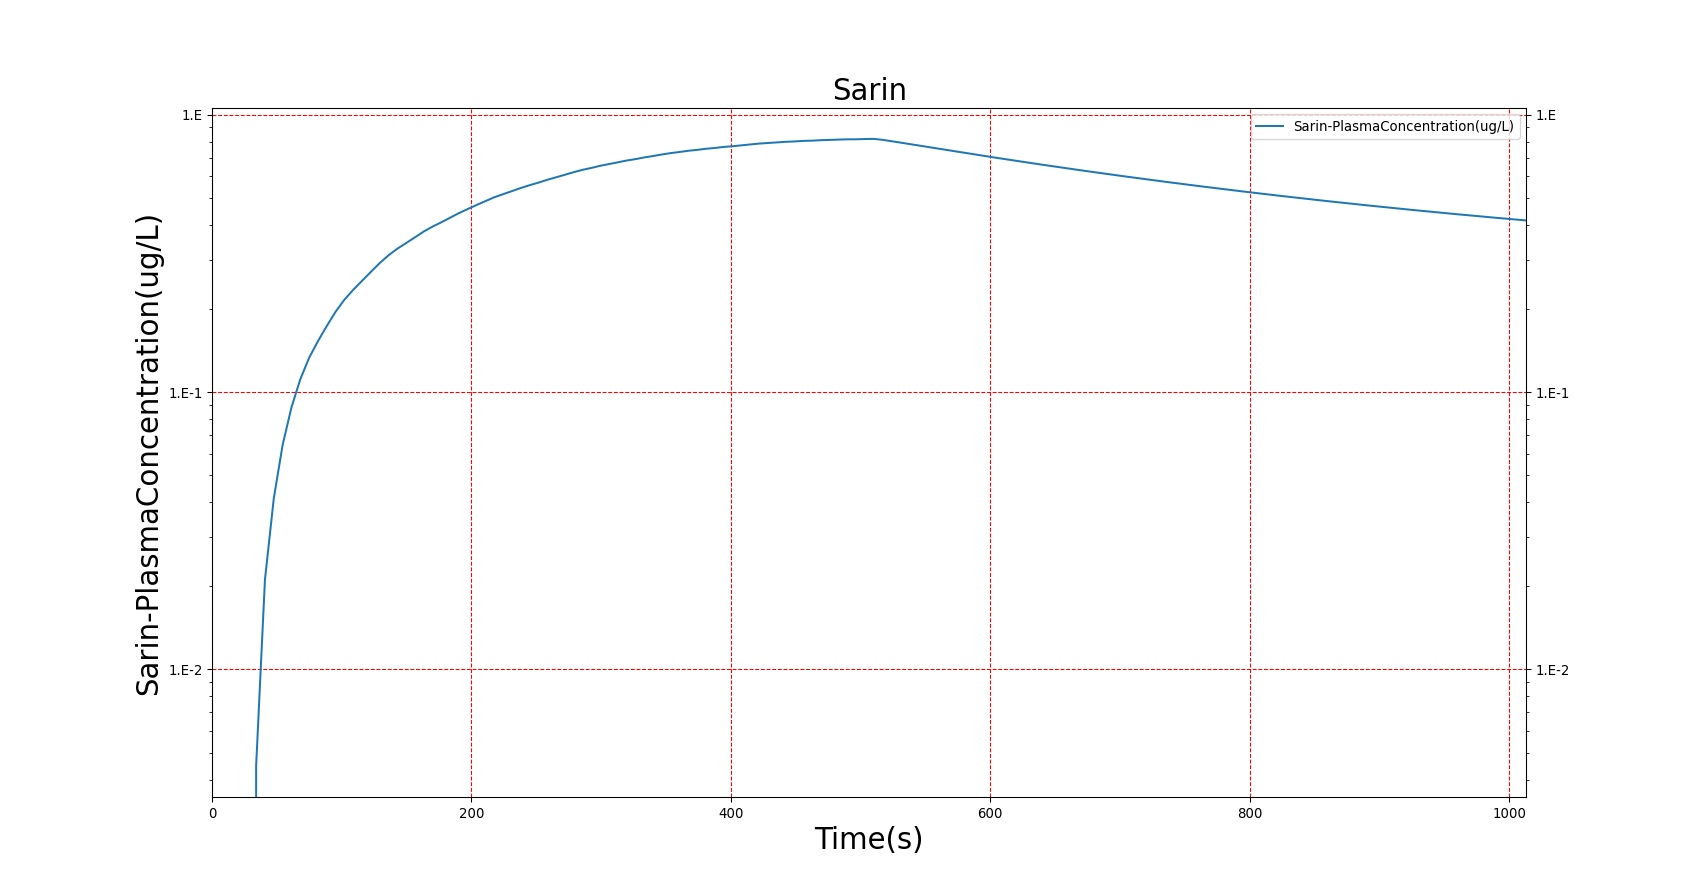
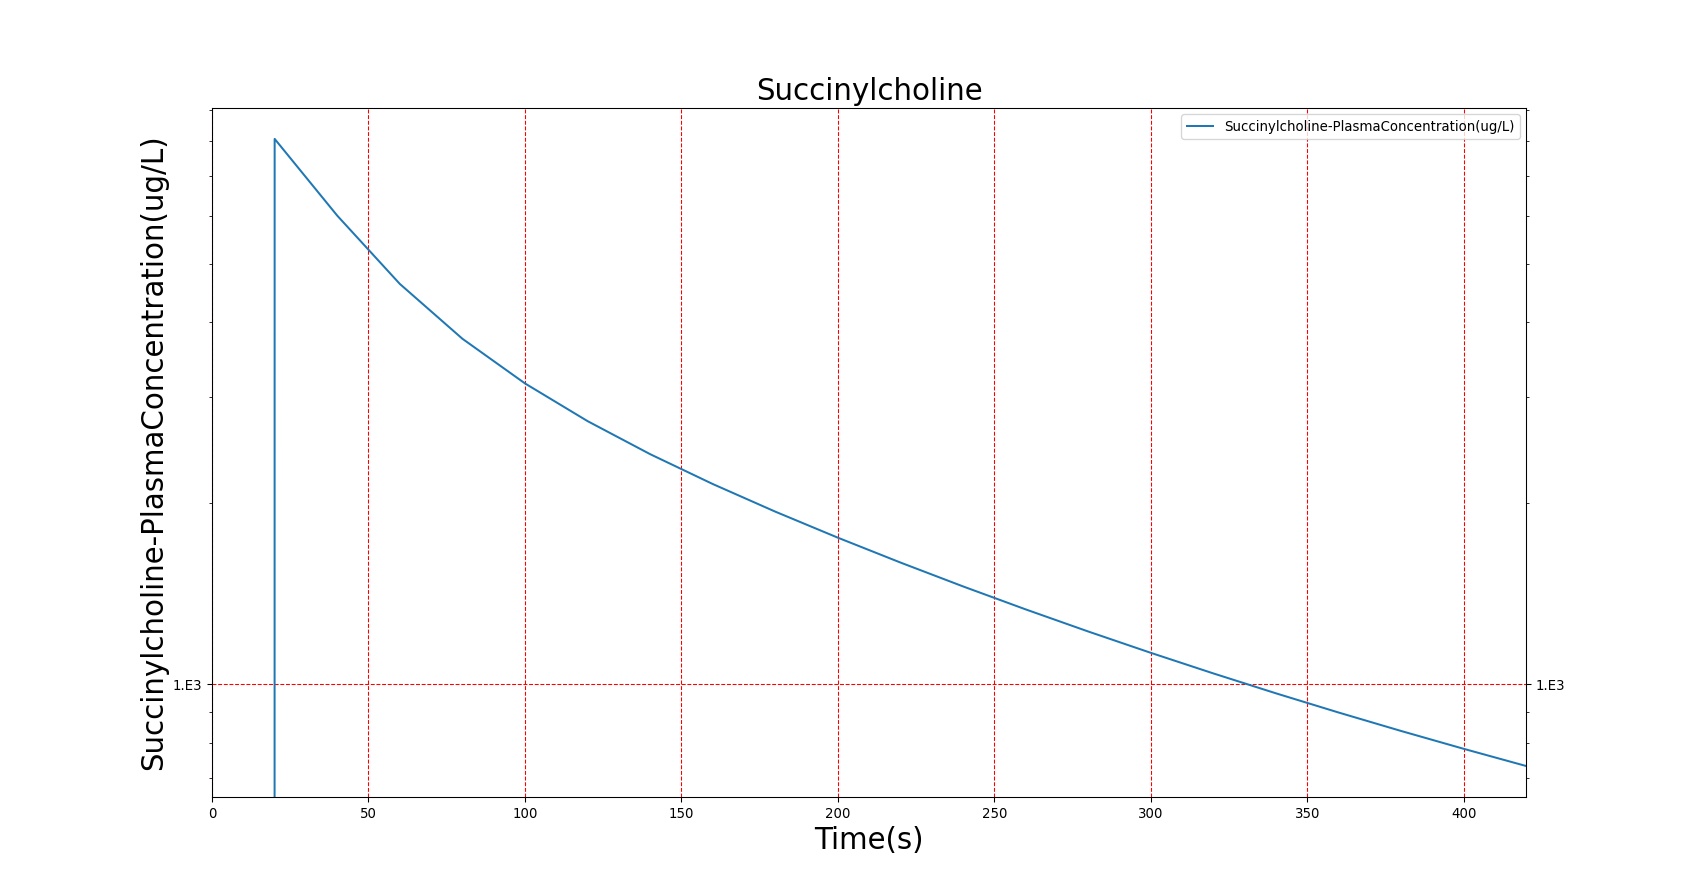

The above results show that, in general, the model chosen for BioGears produces good agreement between experimental and calculated data. However, it also reveals that for some drugs, this model does not appear to be valid. Future work will investigate the incorporation of vaporized substance methodologies, and additional partition coefficient calculations that may prove more accurate for specific drug types. Further statistical analysis will also be undertaken to assess the model performance rather than solely relying on a qualitative analysis.
Validation - Pharmacodynamic
The pharmacodynamic effects of the drugs were validated by comparing the effects of each drug to a number of clinical parameters. A summary of the drug validation is shown in Table 5. More details on the individual scenario validation can be found in the Drugs Scenario Validation Matrix.
| Scenario | Description | Good | Decent | Bad |
|---|---|---|---|---|
| Albuterol | Administer 90 ug metered dose of Albuterol | 5 | 0 | 0 |
| Desflurane | 6% Desflurane breathed in through mask | 4 | 2 | 0 |
| Epinephrine | Adminster 10 ug injection of Epinephrine | 4 | 1 | 0 |
| Fentanyl | Administer 17 mg injection of Fentanyl | 5 | 0 | 0 |
| Furosemide | Administer 40 mg of Furosemide | 3 | 1 | 0 |
| Ketamine | Administer 115 mg injection of Ketamine | 4 | 1 | 0 |
| Midazolam | Administer 5 mg injection of Midazolam | 5 | 0 | 0 |
| Morphine | Administer 2.75 mg/min IV Morphine for 4 minutes | 5 | 0 | 0 |
| Morphine Overdose | Administer 8.2 mg/min IV Morphine for 24 minutes | 3 | 2 | 0 |
| Naloxone | Administer 17 mg injection of Fentanyl Followed by 30 ug injection of Naloxone *Validating only Naloxone | 5 | 0 | 0 |
| Pralidoxime | Adminster 700 mg injection of Pralidoxime | 5 | 0 | 0 |
| Prednisone | Administer 20 mg injection of Prednisone | 5 | 0 | 0 |
| Propofol | Administer 135 mg injection of Propofol | 4 | 0 | 0 |
| Rocuronium | Administer 52 mg injection of Rocuronium | 2 | 0 | 0 |
| Sarin | Exposure to 5 concentrations in the environment | 21 | 4 | 0 |
| Succinylcholine | Administer 96 mg injection of Succinylcholine | 3 | 2 | 0 |
| Tranexamic Acid | Administer 200 mg of TXA | 8 | 0 | 0 |
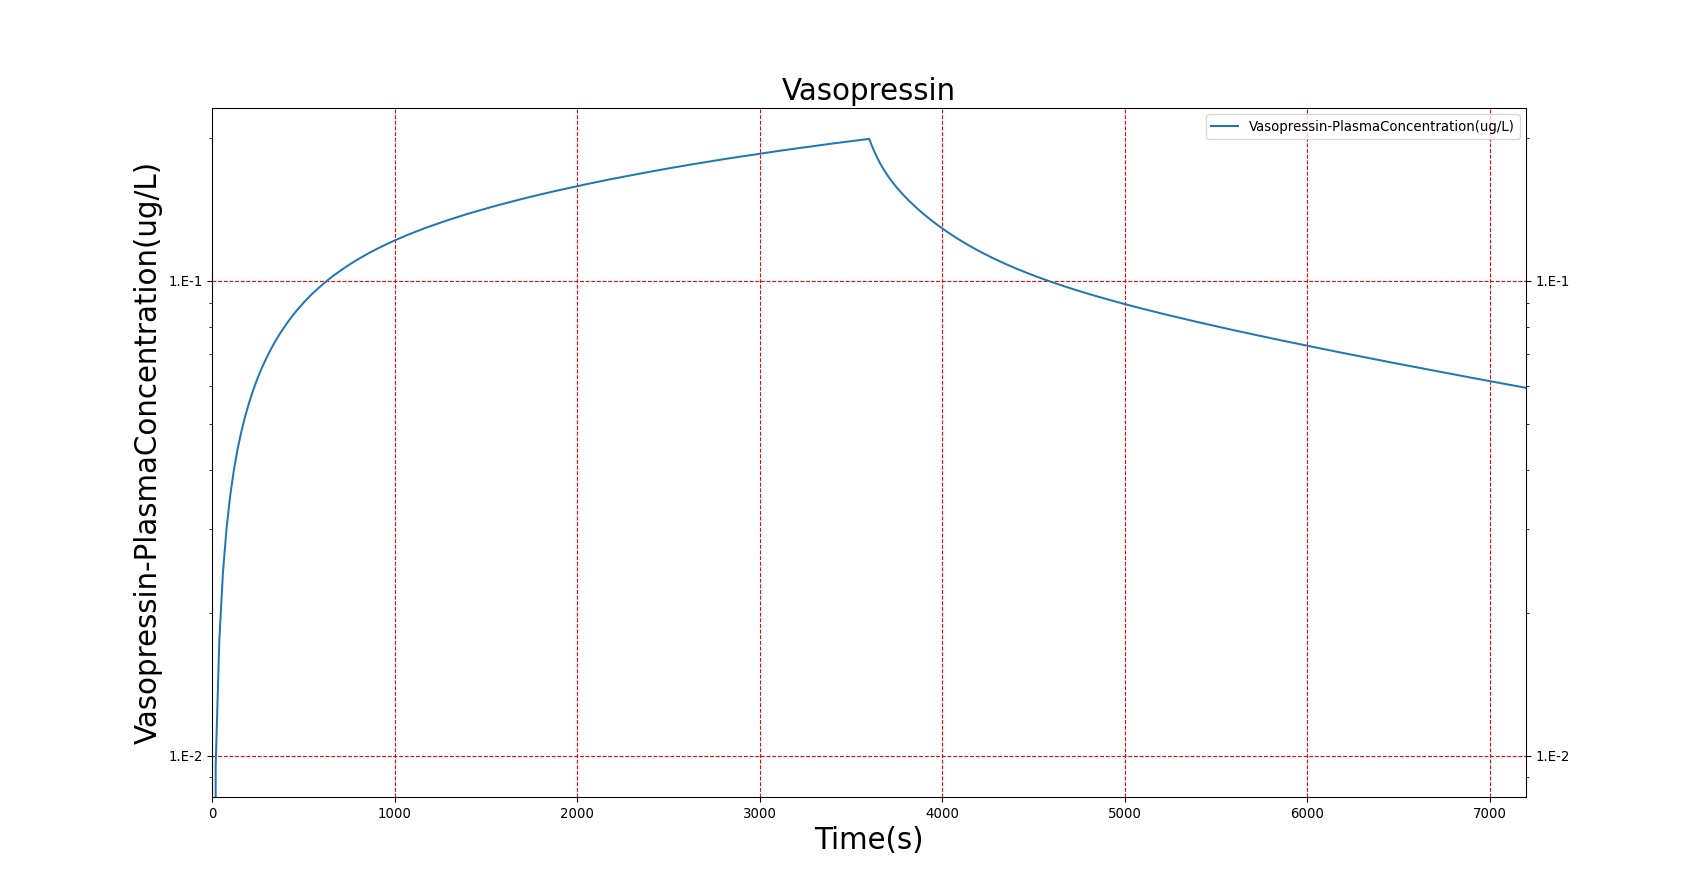
| Vasopressin | Ramp dose of vasopressin from 0.04 to 0.18 to 0.25 ug | 3 | 2 | 0 |
| Total | 94 | 15 | 0 |
| Event | Notes | Action Occurrence Time (s) | Sample Scenario Time (s) | Heart Rate (beats/min) | Systolic Pressure (mmHg) | Diastolic Pressure (mmHg) | Respiration Rate (breaths/min) | Oxygen Saturation |
|---|---|---|---|---|---|---|---|---|
| Administer Epinephrine - 10ug | Drug Onset < 1 minute | 30 | 30 | 25-50% Increase [242] | 25-50% Increase [242] | 25-50% Increase [242] | NC [242] | NC |
| Administer Fentanyl - 300 ug | Drug Onset 2-4 minutes | 30 | 600 | Stable [113] p192-7, [257] p277; 5-10% Decrease [242] | Stable [113] p192-7, [257] p277; 5-10% Decrease [242] | Stable [113] p192-7, [257] p277; 5-10% Decrease [242] | Decrease � 50% [221], [407] | Decrease below 95% [221] |
| Administer Ketamine - 115 mg | Drug Onset < 1 minute | 30 | 300 | Moderate Increase [113] p200; 15-25% Increase [242] | Moderate Increase [113] p200; 15-25% Increase [242] | Moderate Increase [113] p200; 15-25% Increase [242] | Mild Decrease [113] p200; 25-50% Decrease [242] | NC |
| Administer Midazolam - 5 mg | Drug Onset in 1-3 min and lasts 30-60 minutes | 30 | 70 | Mild Increase [113] p200; 5-10% Decrease [242] | Moderate Decrease [113] p200; 15-25% Decrease [242] | Moderate Decrease [113] p200; 15-25% Decrease [242] | Moderate Decrease [113] p200; Marked Decrease To 0 [242] | As long as some respiration rate, little change. If RR=0, then begins to drop along O2 curve. |
| Administer Morphine - 2.75 mg/min | Constant rate of infusion for 4 minutes (11 mg total) | 30-270 | 5000 | Decrease 4-10% [349] | Minimal Decrease [349] or NC [122] | Minimal Decrease [349] or NC [122] | Decrease 25-30% [247] | Remain above 95% [317] |
| Administer Naloxone - 200 ug - in response to Fentanyl | Naloxone is modeled as a competitive inhibitor of opioids; it exhibits minimal PD effects alone | 30 = 300 ug Fentanyl; 300 = 200 ug Naloxone | 250; 1000 | Return to resting state [122] | Return to resting state [122] | Return to resting state [122] | Return to resting baseline [122] | Increase |
| Administer Prednisone - 20 mg | Drug Onset in less than 1 minute | 30 | 100 | NC [306] | NC [306] | NC [306] | NC [306] | NC [306] |
| Administer Propofol - 200 mg | Drug Onset in less than 1 minute | 30 | 70 | NC [113] p200; NC [242] | Marked Decrease [113] p200; 25-40% Decrease [242] | Marked Decrease [113] p200; 25-40% Decrease [242] | Marked Decrease [113] p200; 100% Decrease [242] | Begins to drop according to O2 curve |
| Administer Rocuronium - 50 mg | Drug Onset in 60-90 seconds | 30 | 100 | NC [257] p299; NC [242] | NC [257] p299; NC [242] | NC [257] p299; NC [242] | Goes to Zero [113] p224; Goes to Zero [242] | Begins to drop according to O2 curve |
| Administer Succinycholine - 77 mg | Drug Onset < 1 minute | 30 | 70 | Mild Increase [113] pp210-5; 5-10% Decrease [242] | Mild Increase [113] pp210-5; 5-10% Decrease [242] | Mild Increase [113] pp210-5; 5-10% Decrease [242] | Goes to Zero [113] p224; Goes to Zero [242] | Begins to drop according to O2 curve |
| Administer Vasopressin – 0.04, 0.18, and 0.25 ug | Infusions are successive, each lasts 20 minutes | 30, 1230, 2430 | 2430 | Decrease � 25% [224] | Increase 7-8 mmHg [224] | Increase 7-8 mmHg [224] | NC [224] | NC [224] |
| Event | Notes | Action Occurrence Time (s) | Sample Scenario Time (s) | Heart Rate (beats/min) | Systolic Pressure (mmHg) | Diastolic Pressure (mmHg) | Respiration Rate (breaths/min) | Tidal Volume (mL) | Oxygen Saturation |
|---|---|---|---|---|---|---|---|---|---|
| Administer Albuterol - 10ug | Drug Onset < 1 minute | 30 | 200 | 25-50% Increase [131] | Slight Increase [131] | Slight Increase [131] | NC [131] | NC [131] | NC |
| Event | Notes | Action Occurrence Time (s) | Sample Scenario Time (min) | Urine Production Rate (mL/min) | Chloride Excretion (mmol/min) | Sodium Excretion (mol/min) | Vascular Volume (mL) |
|---|---|---|---|---|---|---|---|
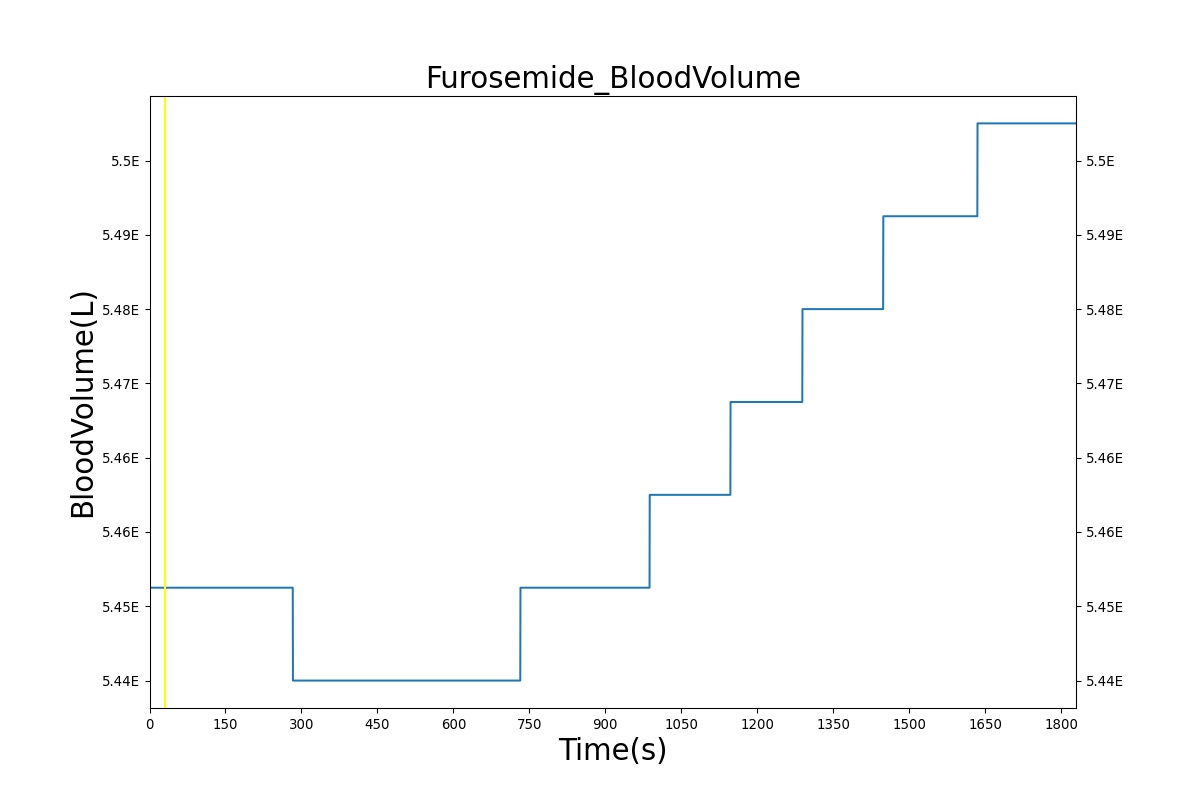
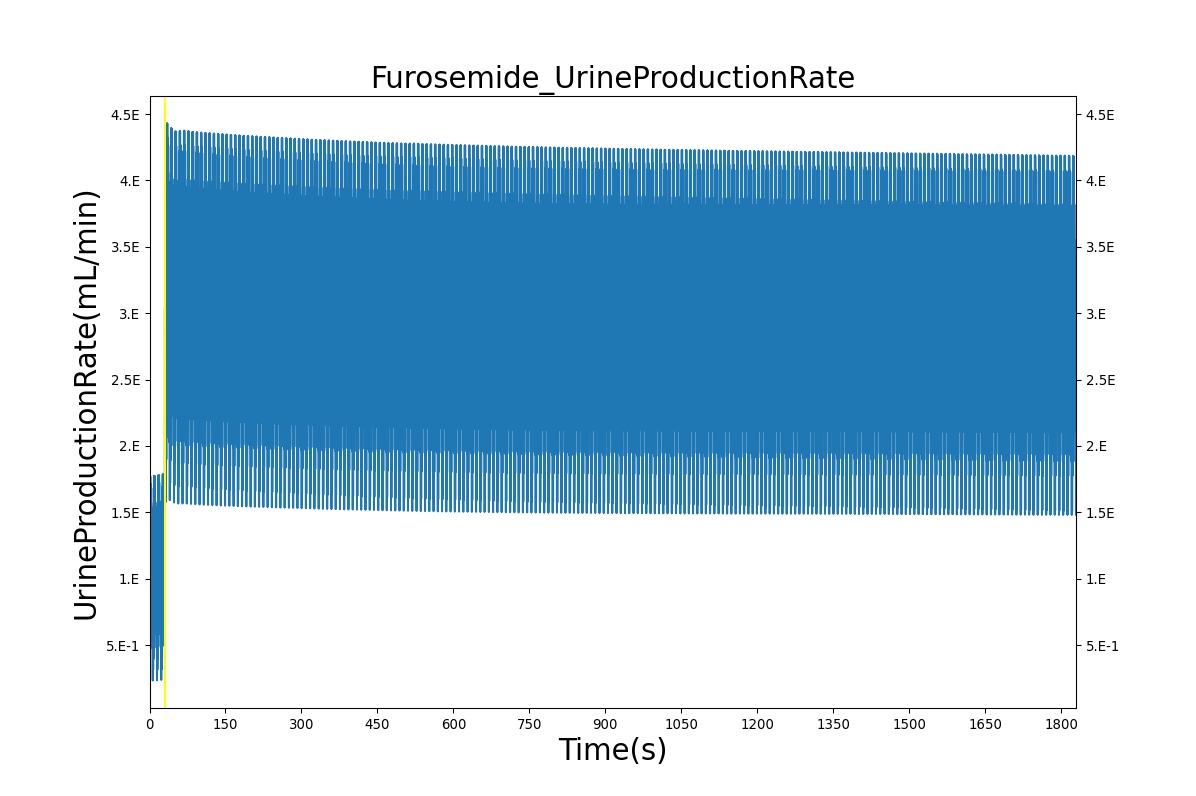
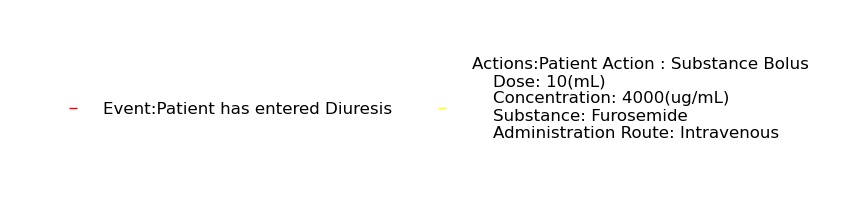
| Administer Furosemide - 40 mg | Drug Onset < 1 minute | 30 | 450 | 300-400% Increase [175] | 300-400% Increase [175] | 300-400% Increase [175] | Decrease (around 500-1000 mL) [139] |
Diuretic-Furosemide
PD effects for the diuretic Furosemide are handled differently than other drugs in the BioGears patient. Localized effects are implemented via a tubular permeability modifier. This effectively simulates Furosemide's effect on the tubular luminal Na-K-Cl co-transporter, inhibiting reabsorption of fluid and ions into the vasculature, as shown in Figure 19. The permeability modifier is a function of drug concentration in the blood plasma. These concentrations determine appropriate tubular reabsorption inhibition by reducing the permeability of the tubular lumen (for more information, see Renal Methodology). This effectively increases the urine production rate and ion excretion, and reduces the patient's total blood volume. To see the effects of the drug on the cardiovascular system during ventricular systolic dysfunction, see Cardiovascular System.
| |
| |
| |
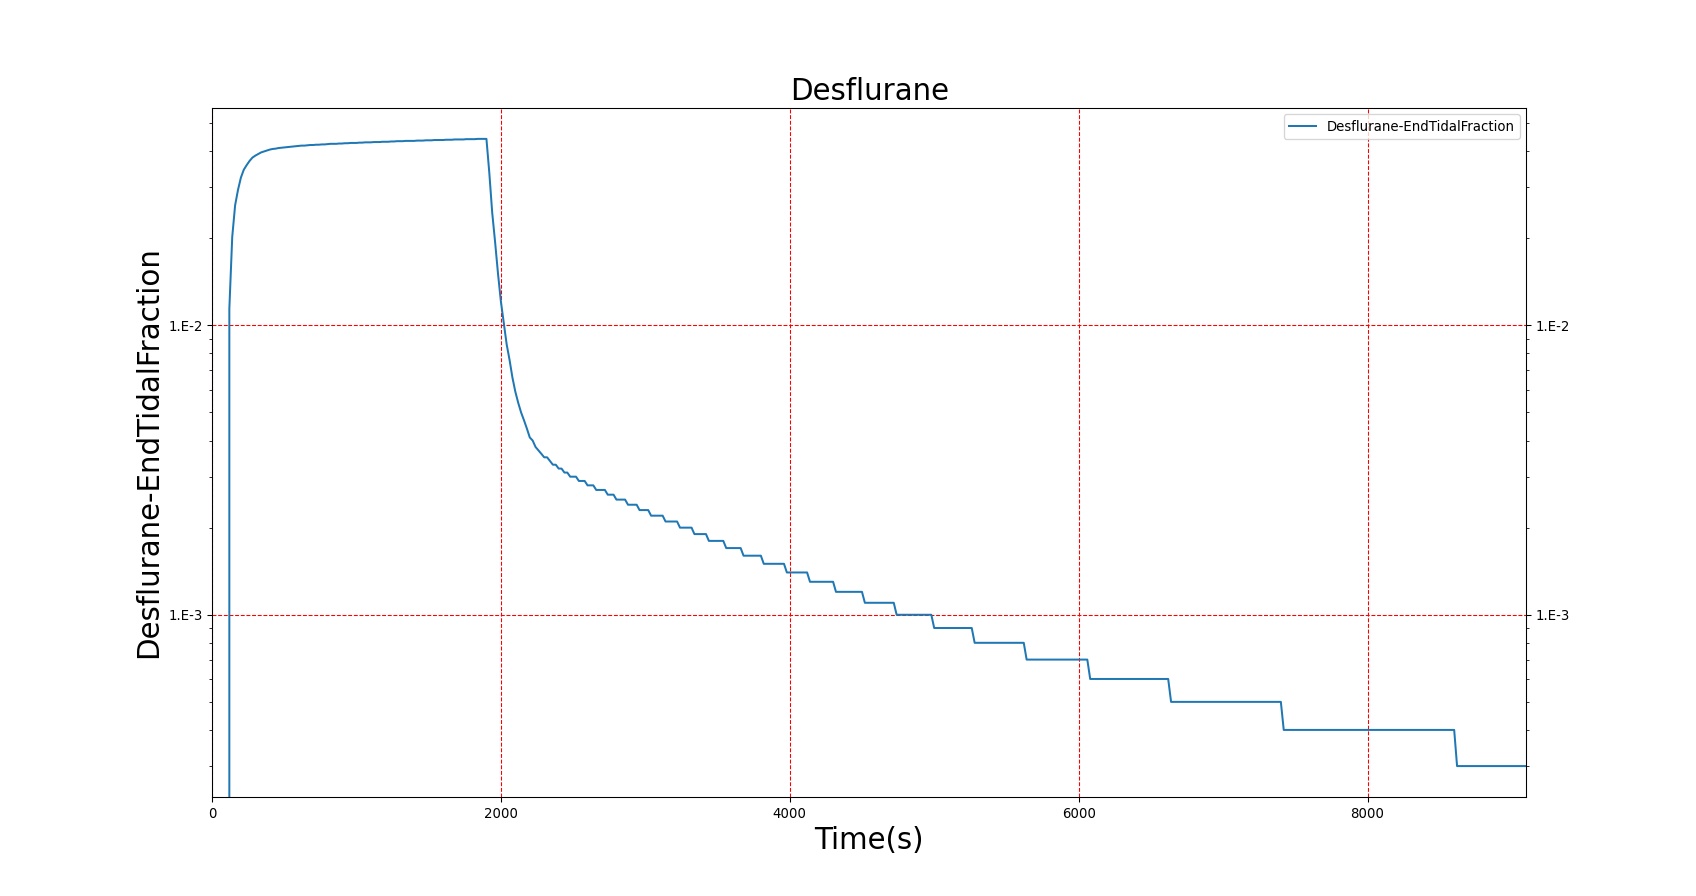
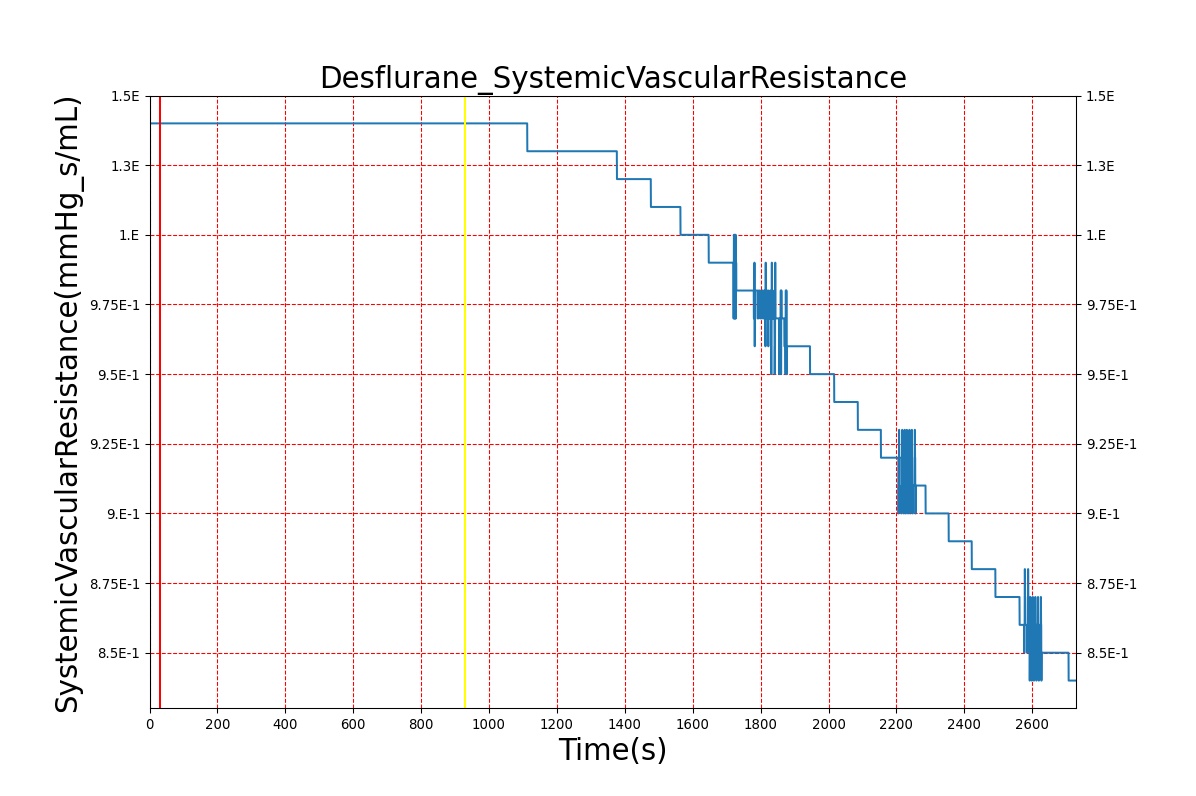
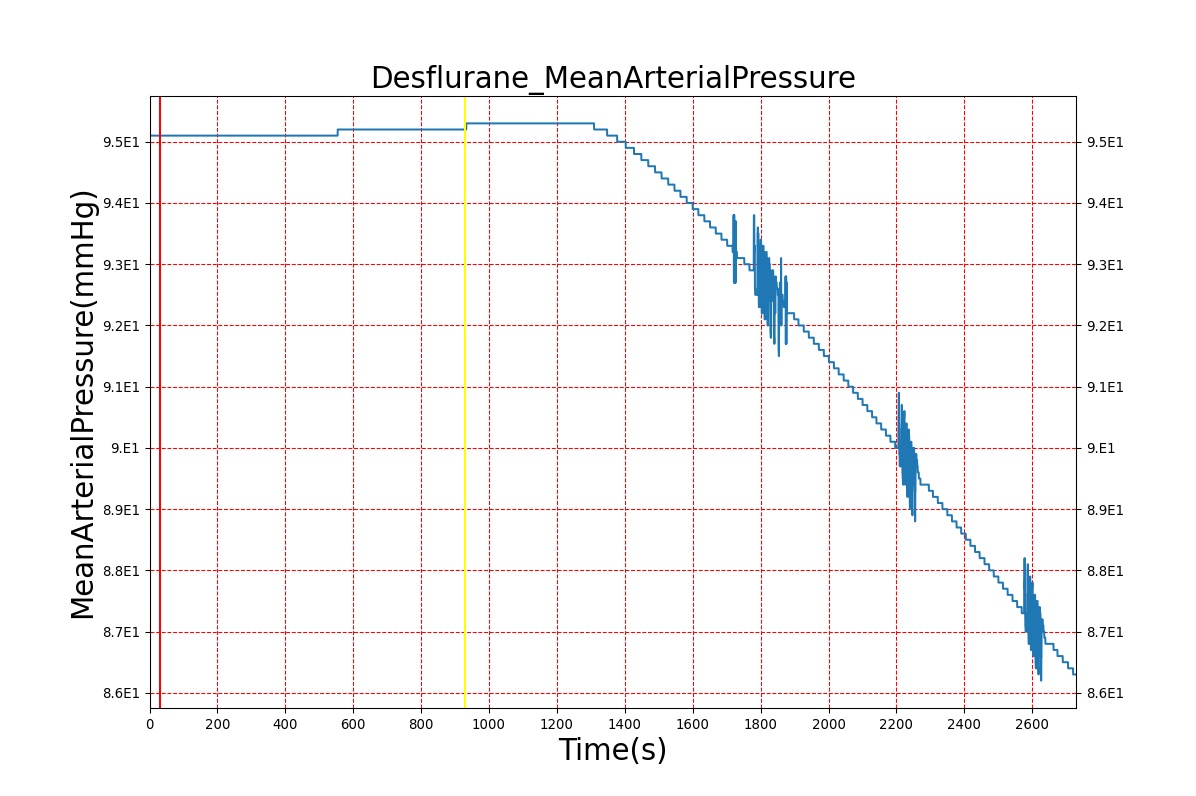
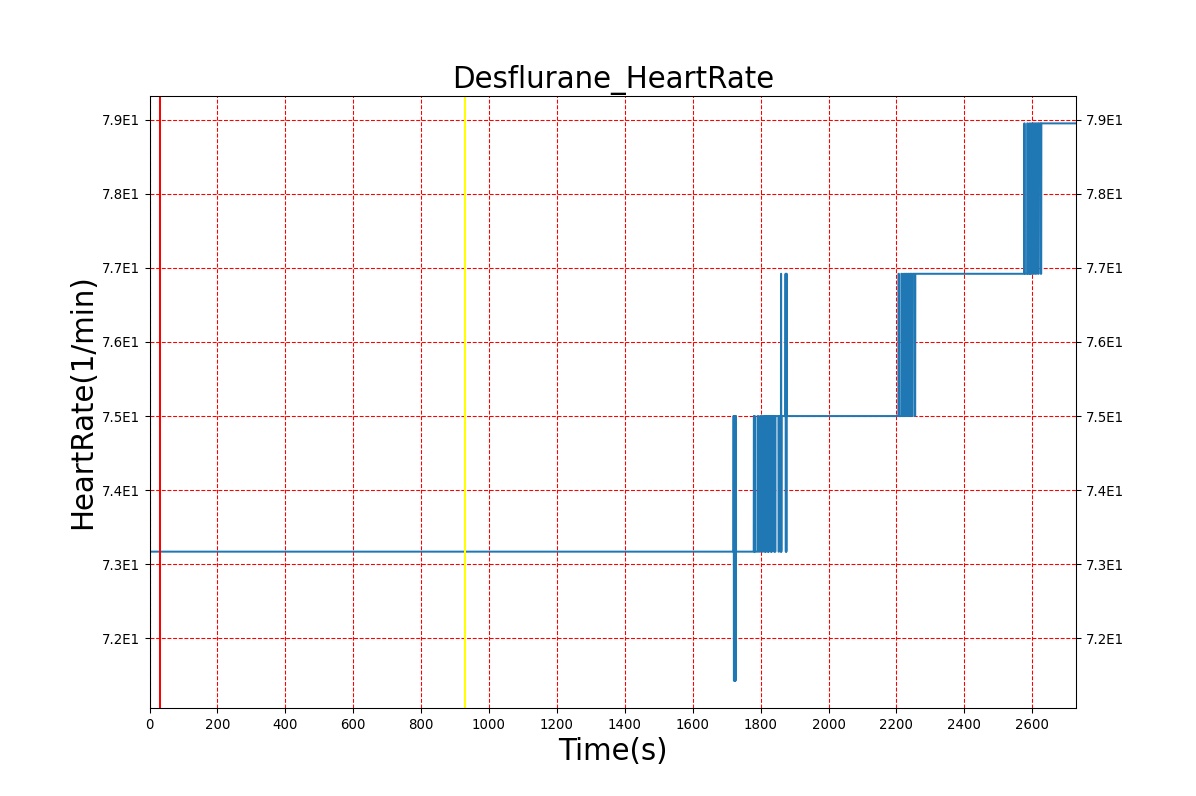
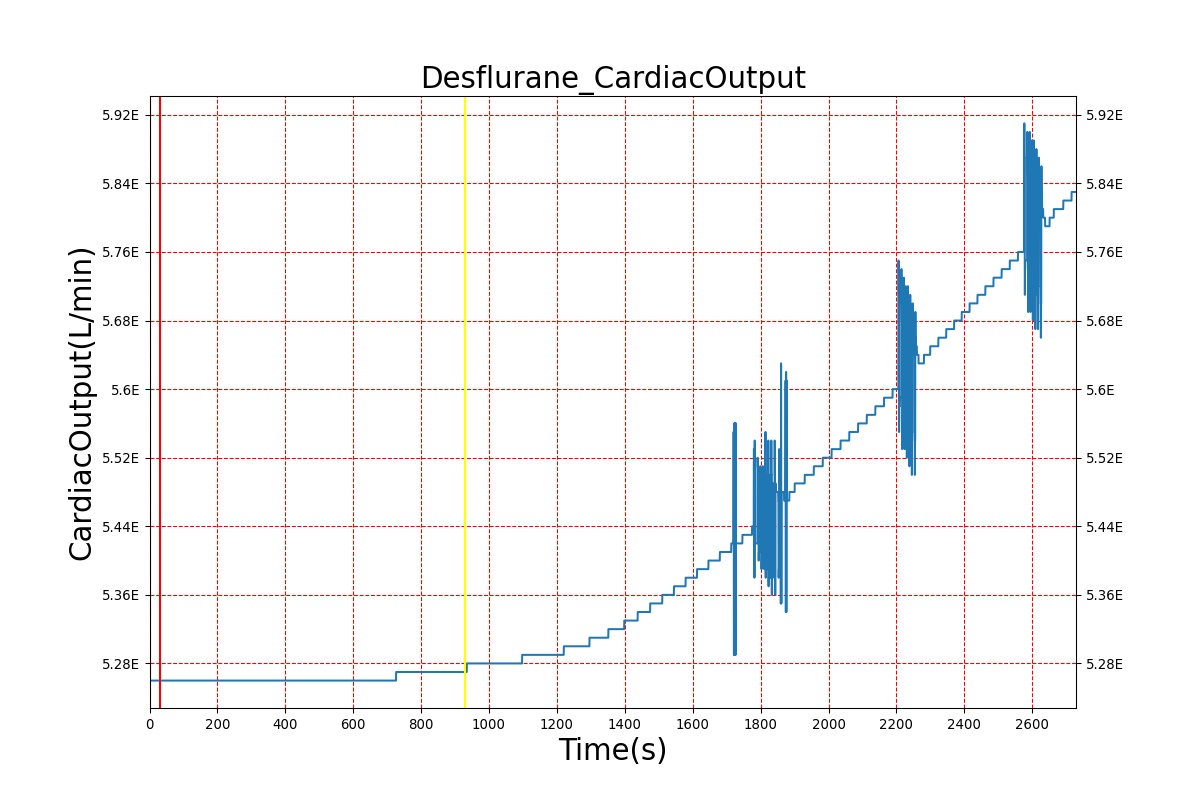
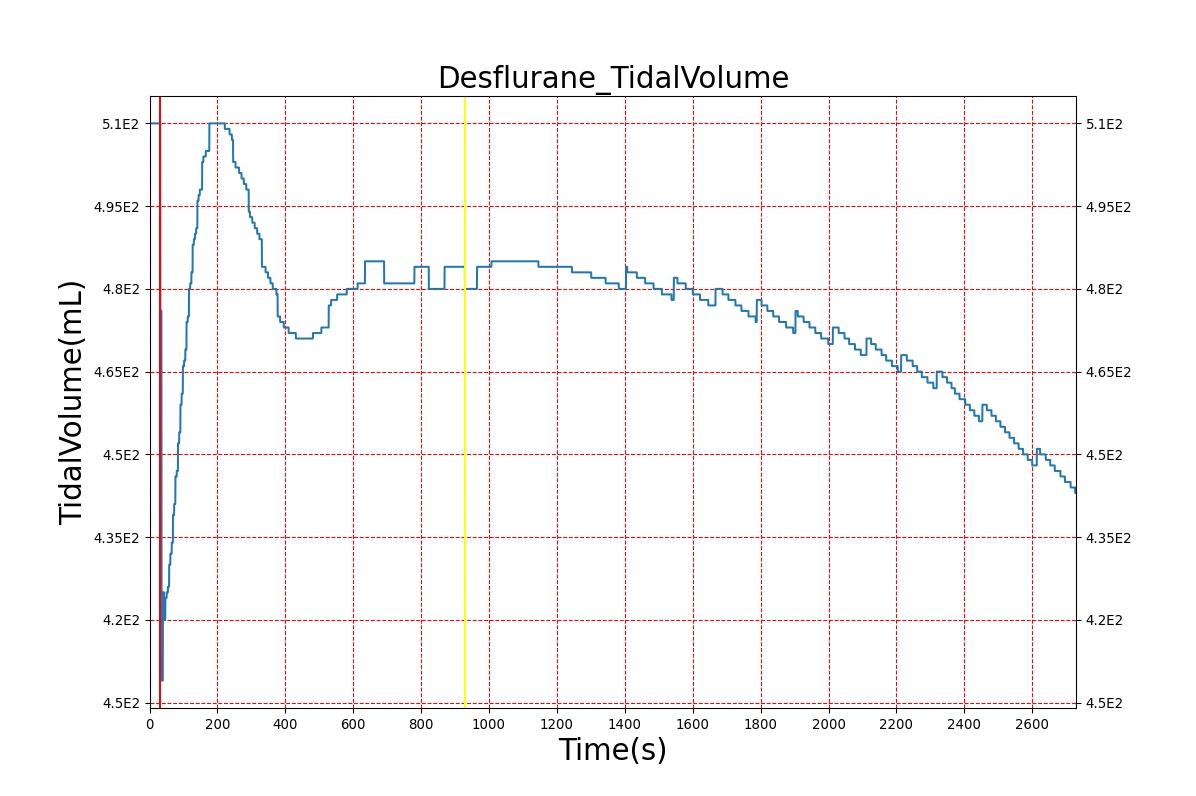
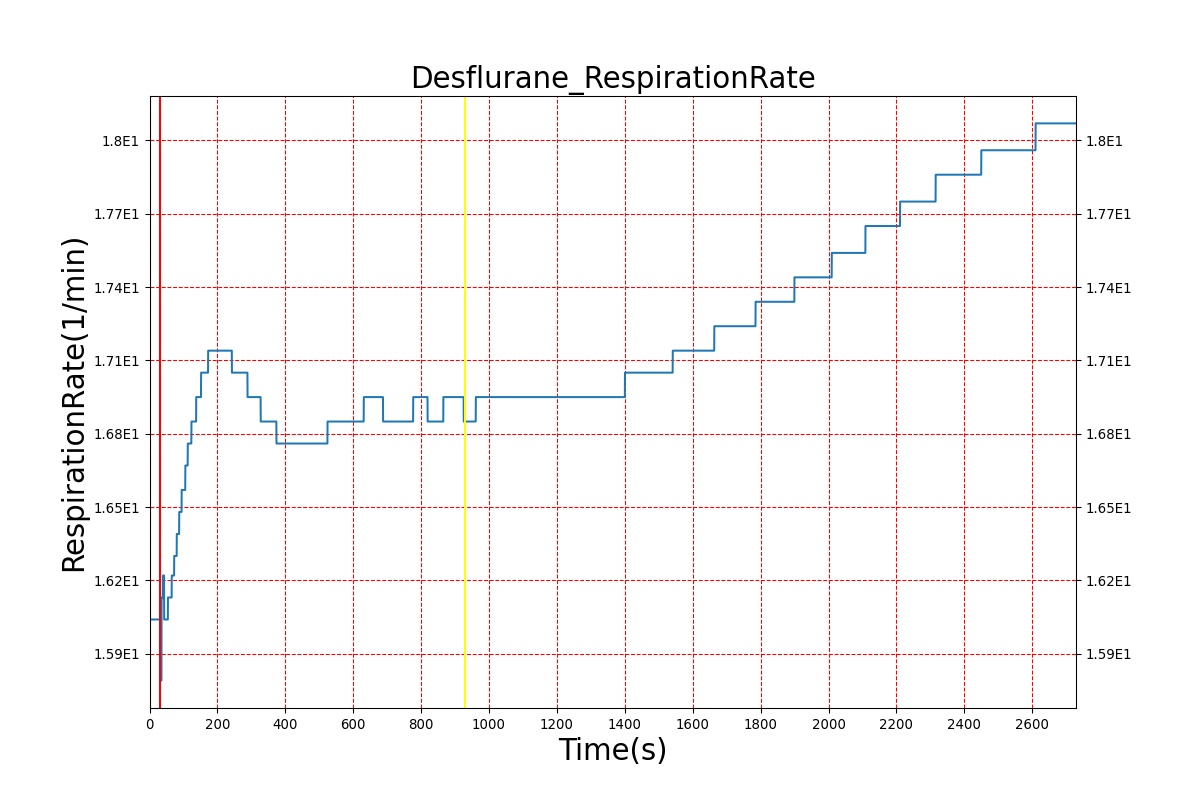
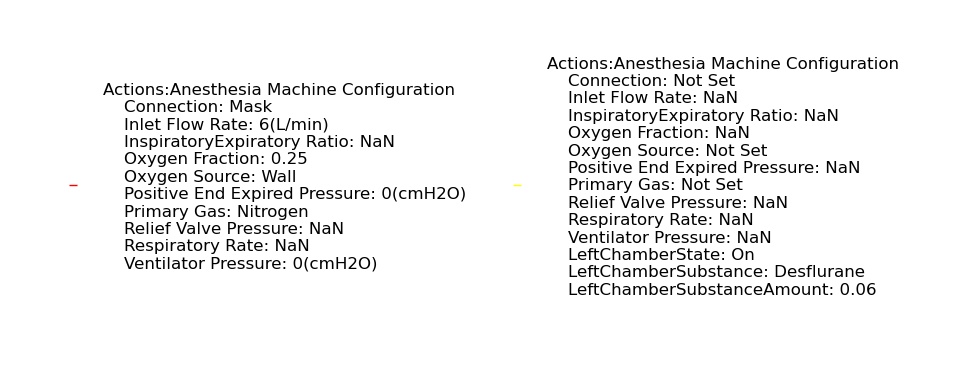
Volatile Anesthetic-Desflurane
| Event | Notes | Action Occurrence Time (s) | Sample Scenario Time (s) | Heart Rate (beats/min) | Mean Arterial Pressure (mmHg) | Systemic Vascular Resistance (mmHg-s/mL) | Cardiac Output (L/min) | Respiration Rate (breaths/min) | Tidal Volume (mL) |
|---|---|---|---|---|---|---|---|---|---|
| Administer-Desflurane 6% | Drug Onset < 1 minute | 80 | 1000 | Approx. 20% increase [385] p169 | Approx. 34% decrease [385] p169 | Approx. 54% decrease [385] p169 | Approx. 30% increase [385] p168 | Approx. 60% increase [188] p485 | Approx. 35% decrease [188] p485 |
| 
|
| 
|
| 
|
| |
Advanced Models
As we work to continuously improve the BioGears Drugs System, we have introduced models that incorporate more advanced features such as Overdose, Drug-Drug Interactions, and Target/Receptor Occupancy. These new capabilities are currently available with respect to the opioids morphine and fentanyl and to the nerve agent Sarin. We plan to generalize these advanced components to the remaining drugs in our library with the goal of increasing overall model accuracy while maintaining flexibility.
Opioids
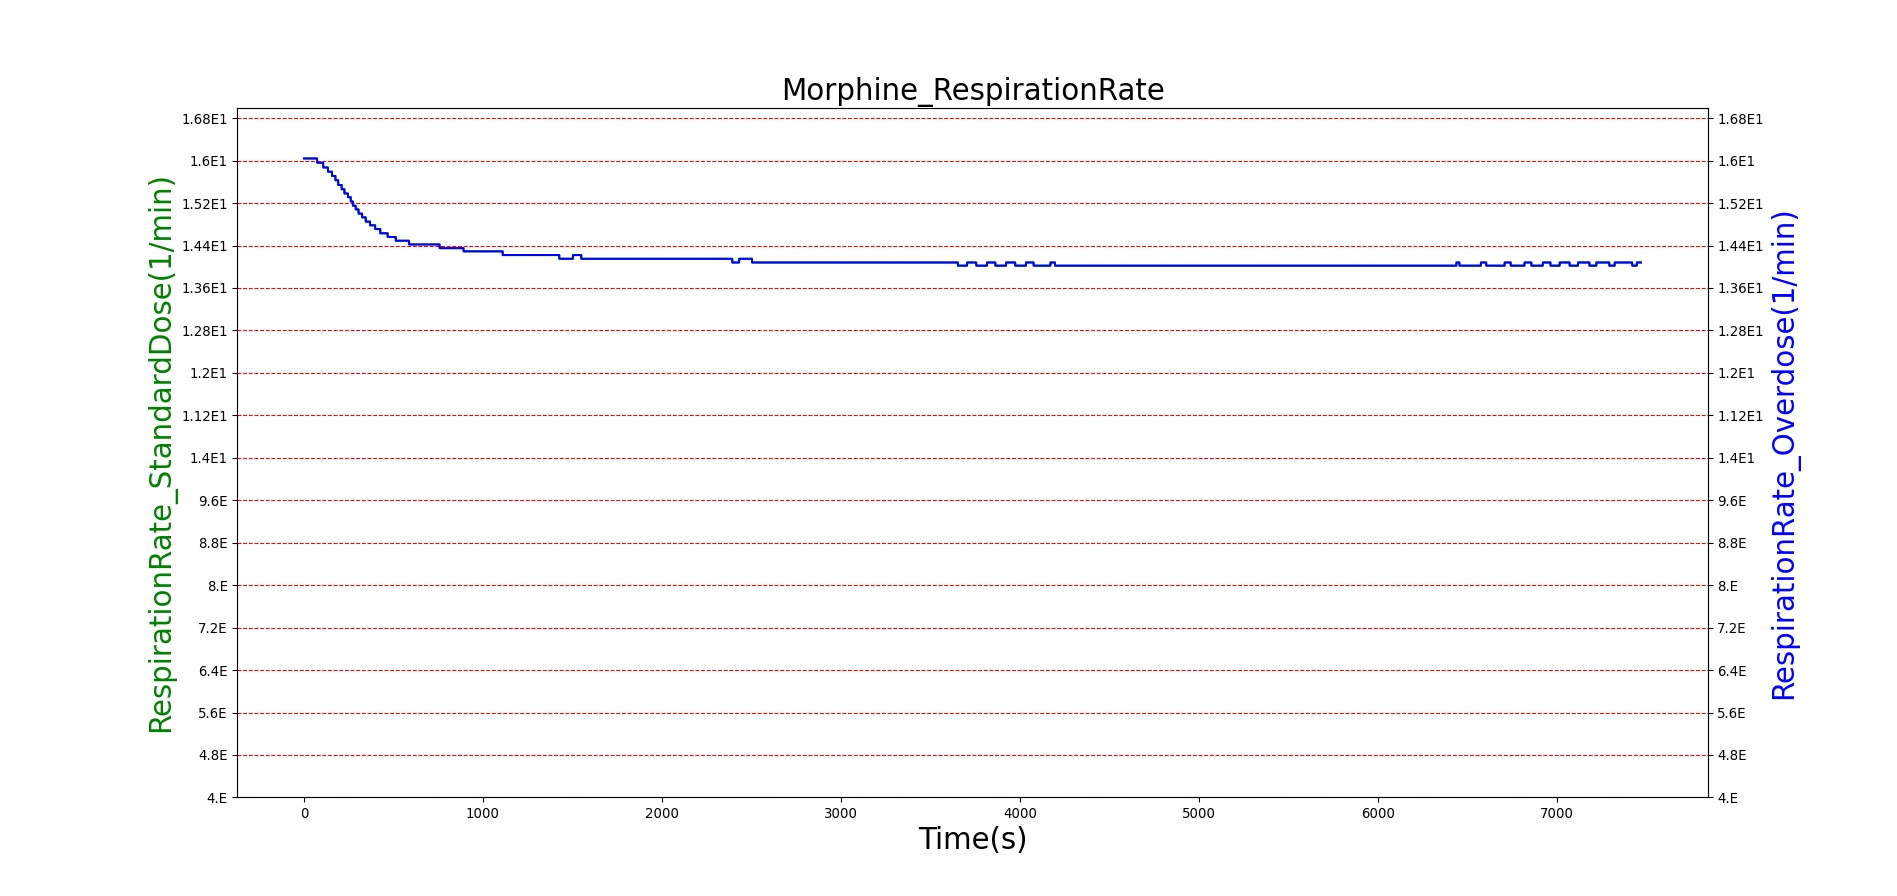
Morphine Intoxication
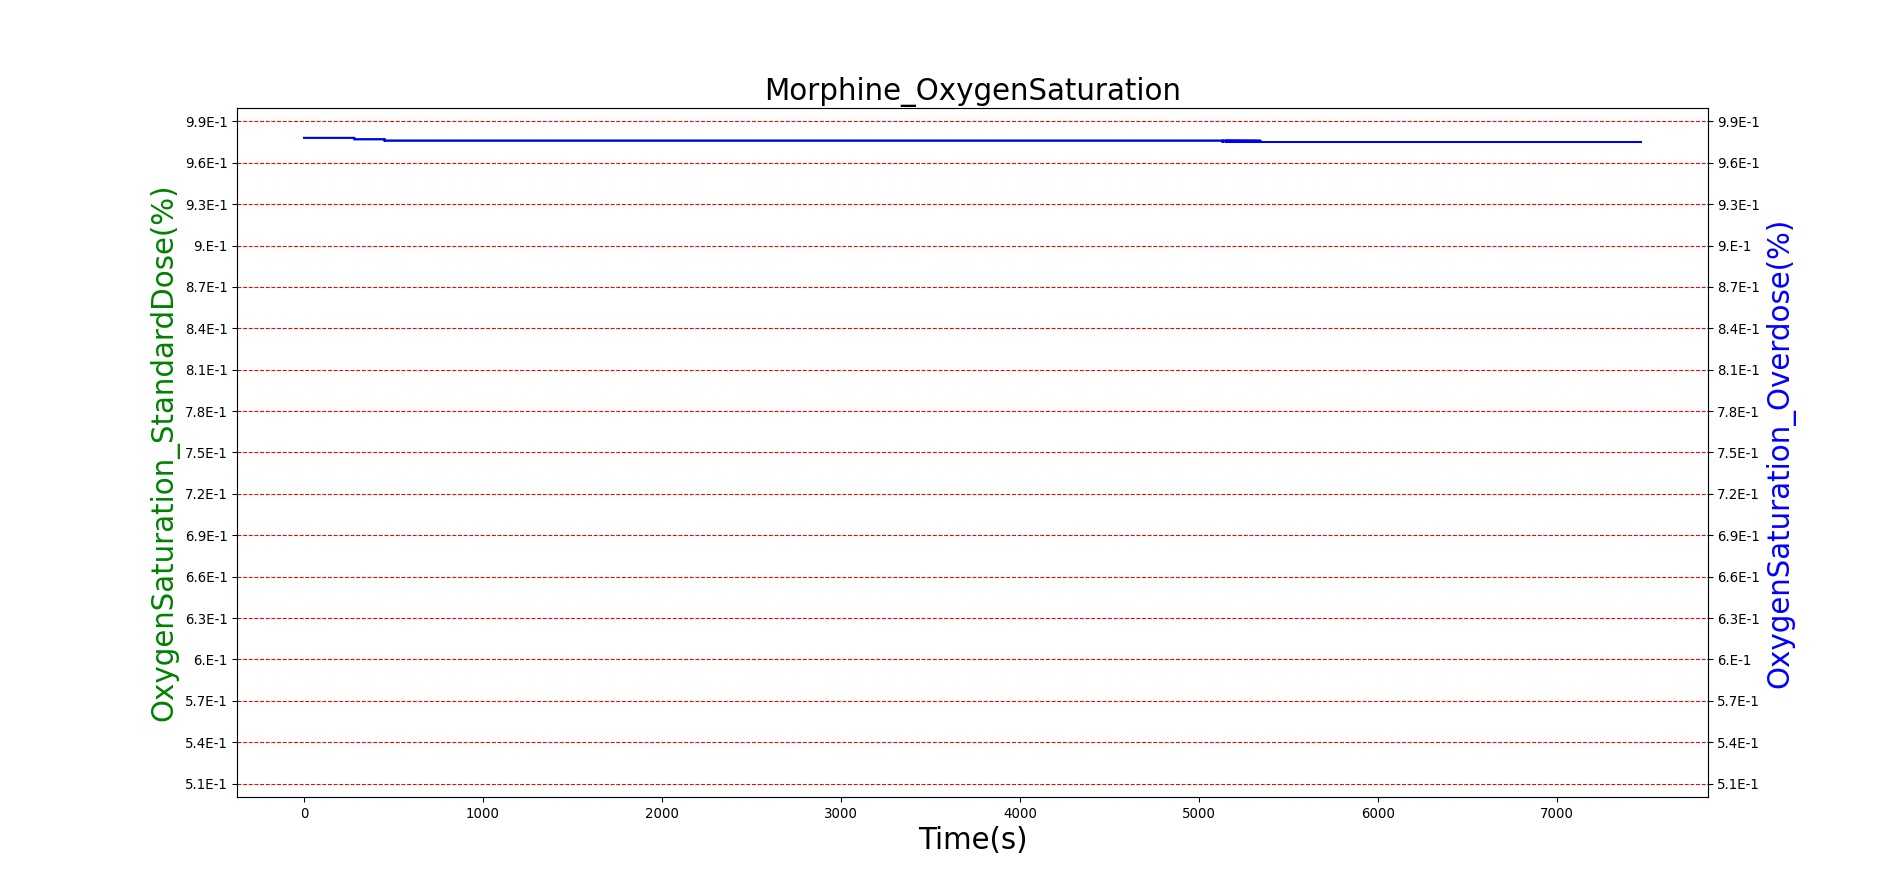
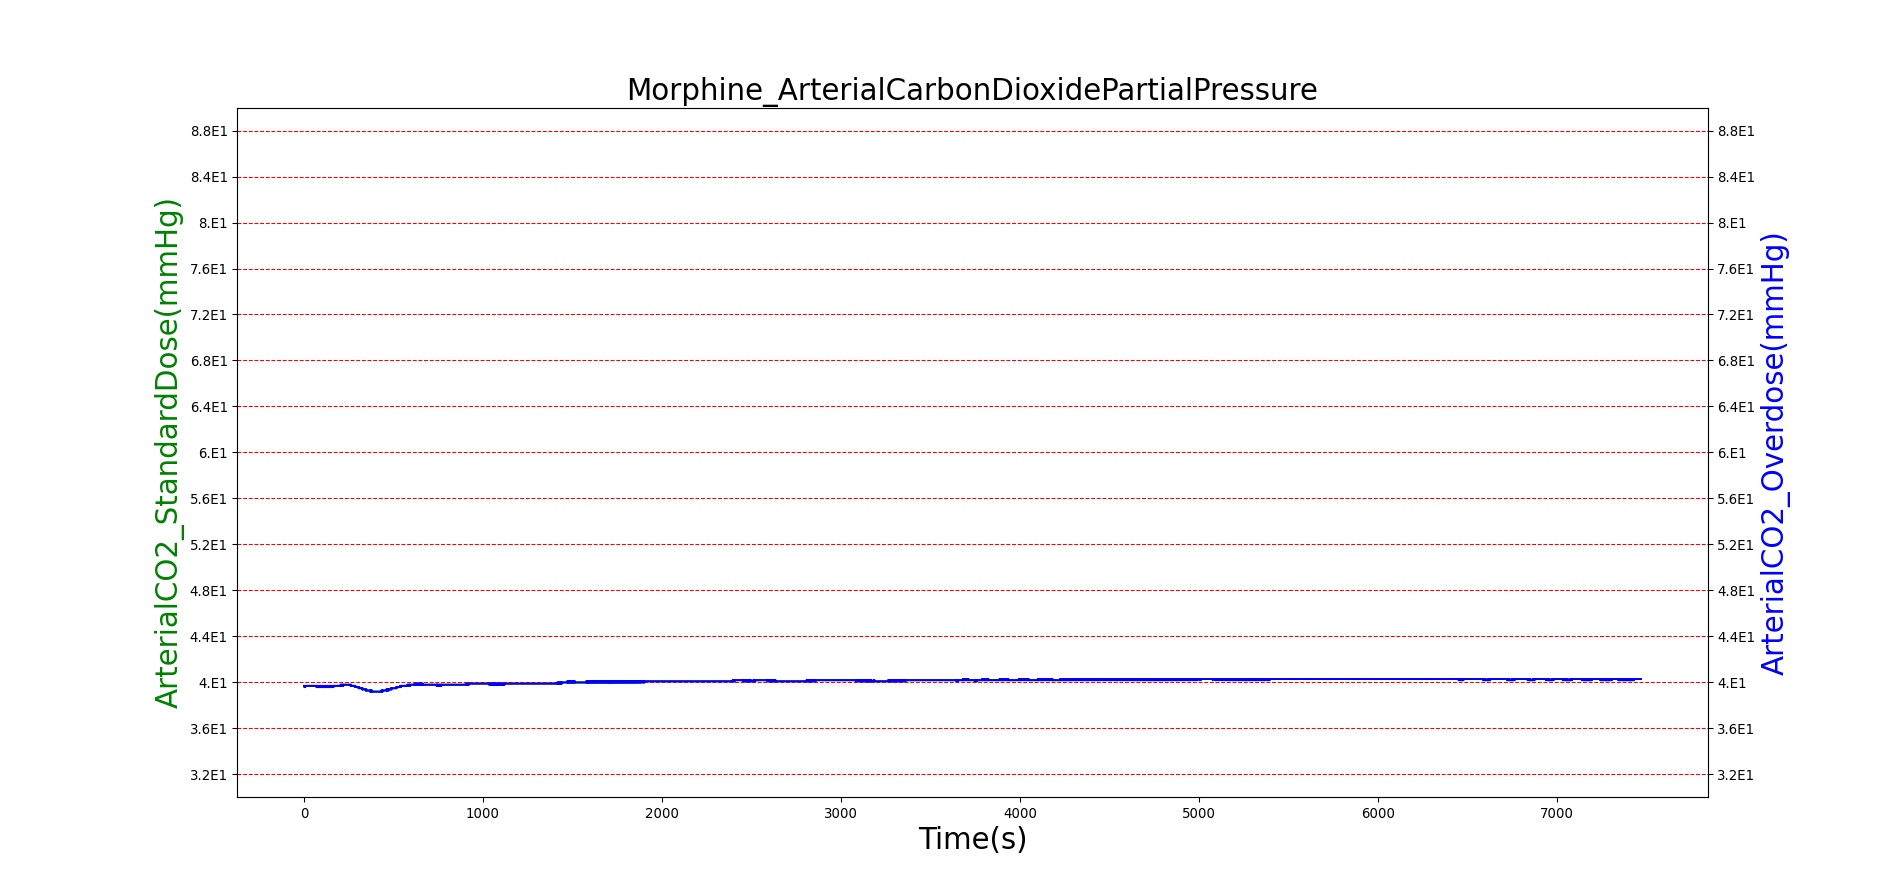
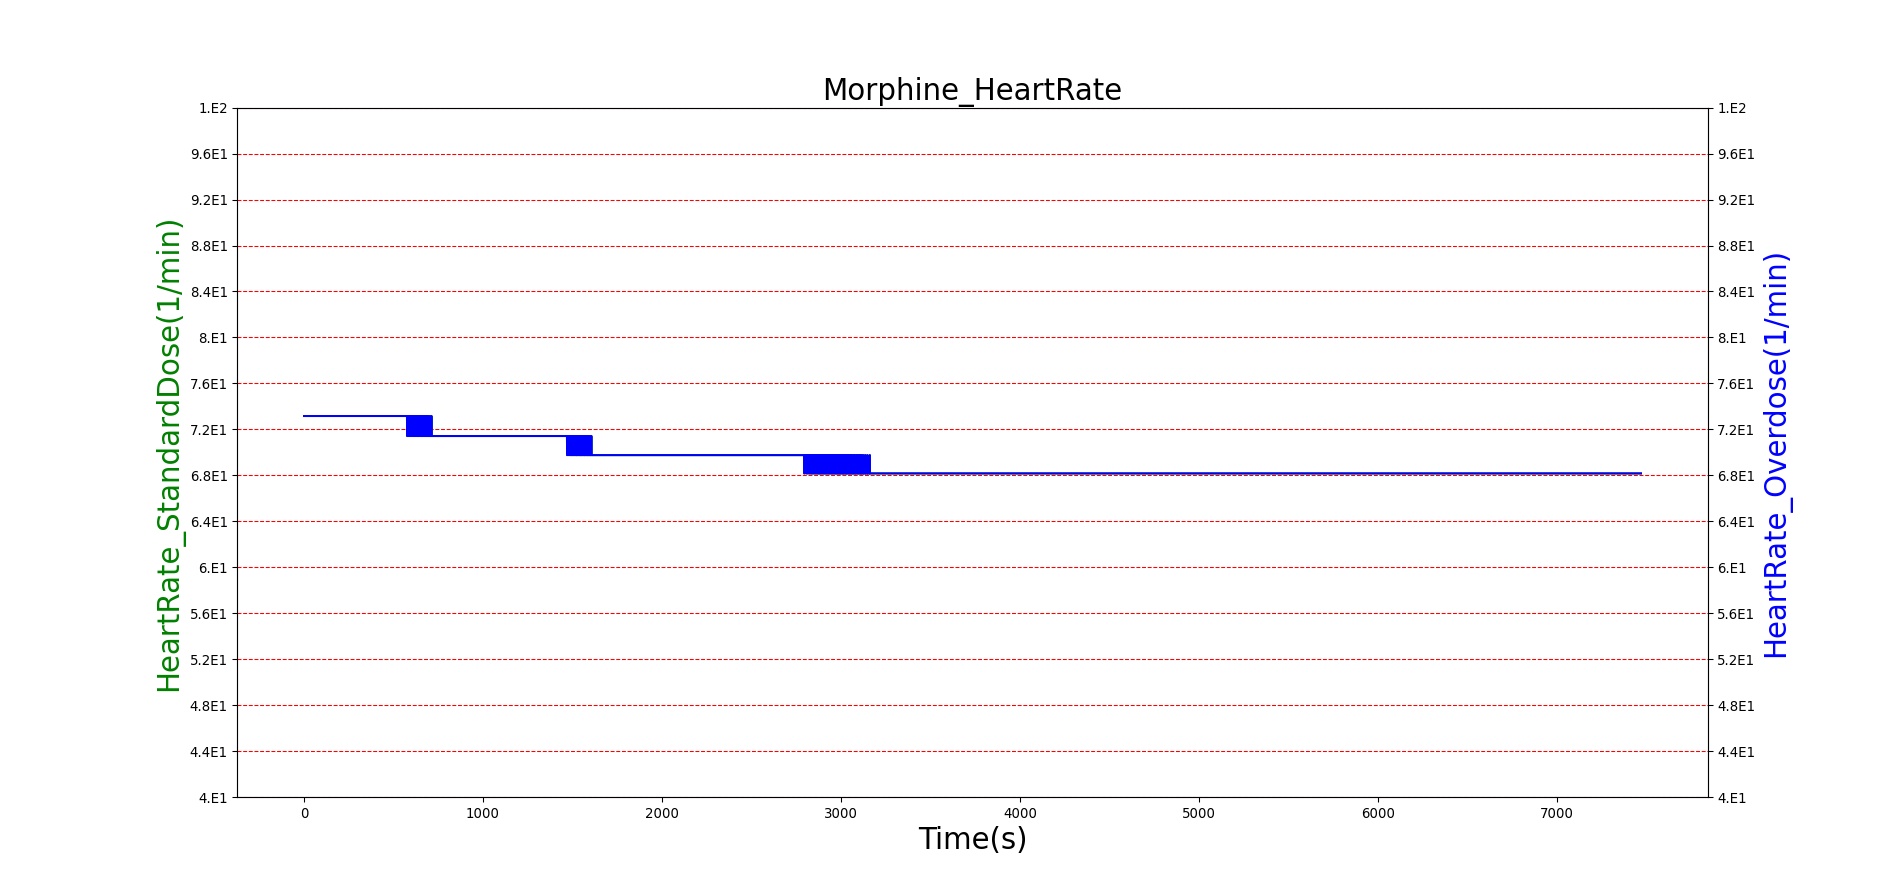
Morphine is the first drug in the BioGears library with parameters tuned to model overdose scenarios. The BioGears overdose scenario is modeled after a case report in which a patient received 200 mg of intravenous Morphine over 24 minutes from a defective patient controlled analgesic (PCA) device and experienced severe opioid ventilatory impairment (OIVI) [77]. Morphine PD parameters were tuned to produce symptoms consistent with OIVI (respiratory depression, hypercapnia, and hypoxia) using both this report and other supporting literature (see Table 10). Figure 21 compares the severe overdose scenario to the standard Morphine dose. Note the prolonged nature of the pharmacological effects, which is a function of Morphine's low effect site rate constant (ke = 0.0026 1/min). In this scenario, the patient does not enter an irreversible state (though one will be triggered at higher doses), making our model somewhat conservative. We took such a conservative approach because opioid sensitivity is extremely variable among patients, particularly between men and women [253]. It should also be mentioned that the tidal volume predicted by our model (not shown) erroneously demonstrates a substantial increase. This is a known issue resulting from the manner in which tidal volume and respiration rate are coupled in the current BioGears respiratory system (see Respiratory Methodology) and will be an area of future work.
| Event | Notes | Action Occurrence Time (s) | Sample Scenario Time (s) | Respiration Rate (breaths/min) | Arterial Carbon Dioxide Pressure (mmHg) | Oxygen Saturation (%) | Heart Rate (bpm) | Blood Pressure (mmg) |
|---|---|---|---|---|---|---|---|---|
| Administer Morphine-2.75 mg/min | Infused at constant rate over 4 minutes (11 mg total) | 30-270 | 5000 | Decrease 25-30% [247] | Increase < 4 mmHg [349] | Remain above 95% [317] | Decrease 4-10% [349] | Minimal Decrease [349] or NC [122] |
| Administer Morphine-8.2 mg/min | Infused at constant rate over 24 minutes (~197 mg total) | 30-1470 | 7200 | <=6 [122], [176] | >55 mmHg [197] | <85% for six minutes [57] | <60 [240] | Hypotension (SBP < 90 and DBP < 60) [240] |
| 
|
| 
|
Figure 21. The Morphine overdose scenario shows the difference in effect betweeen a standard dose (red) an overdose (blue). The timeline below the plots shows the collection of respiratory events thrown in BioGears such as respiratory distress, hypoxia, and hypercapnia.
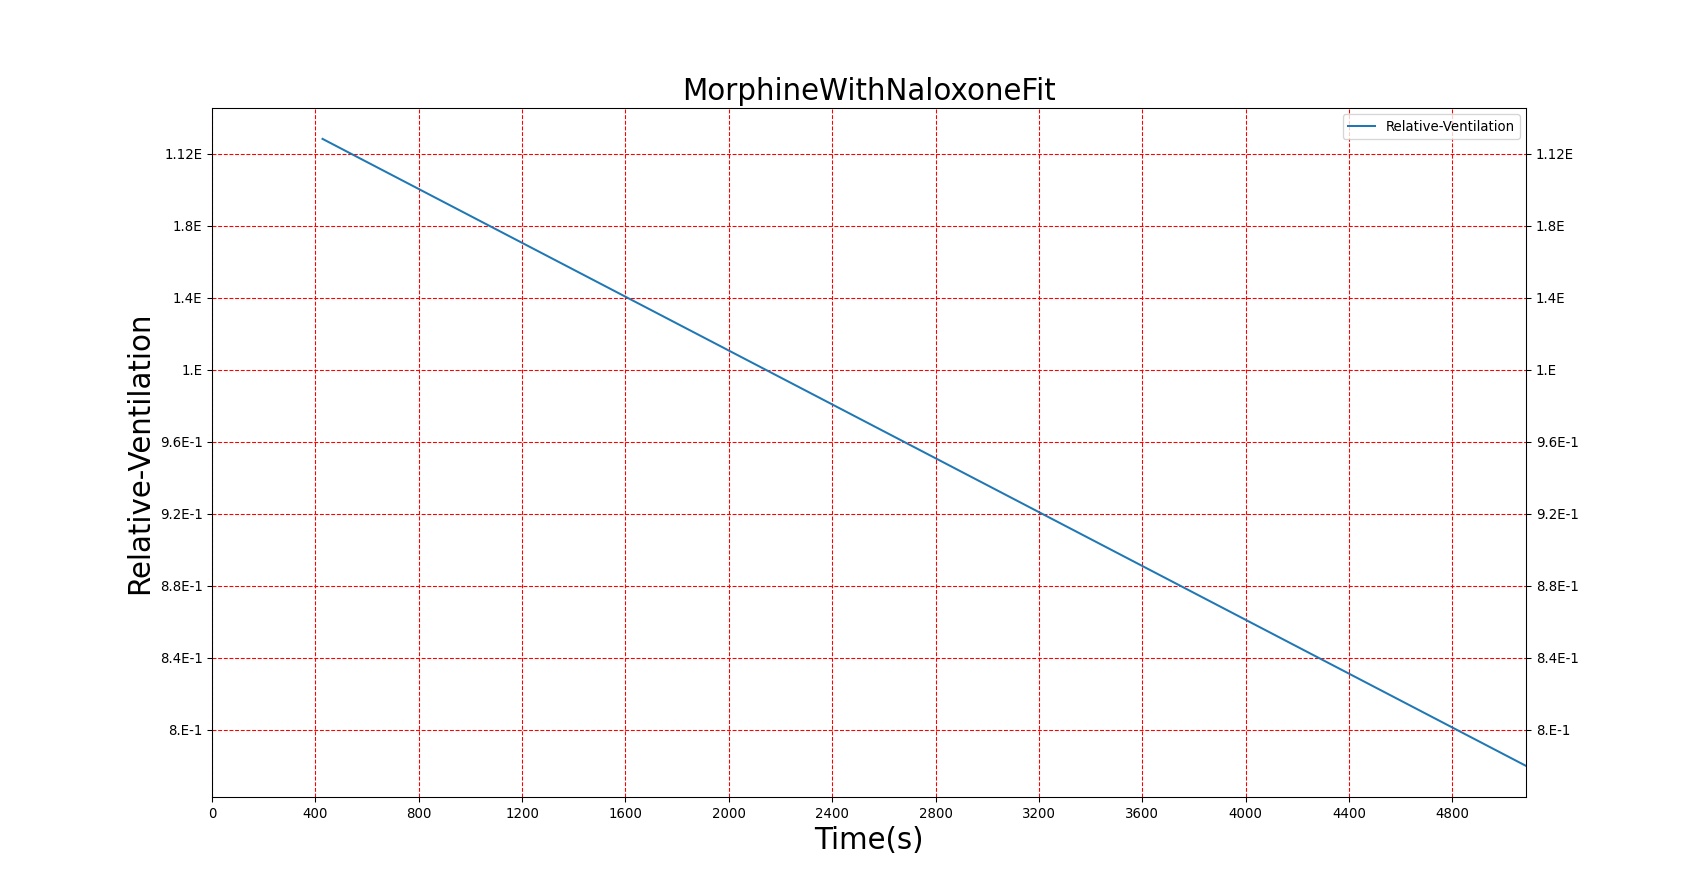
Reversal of Opioid Induced Respiratory Depression
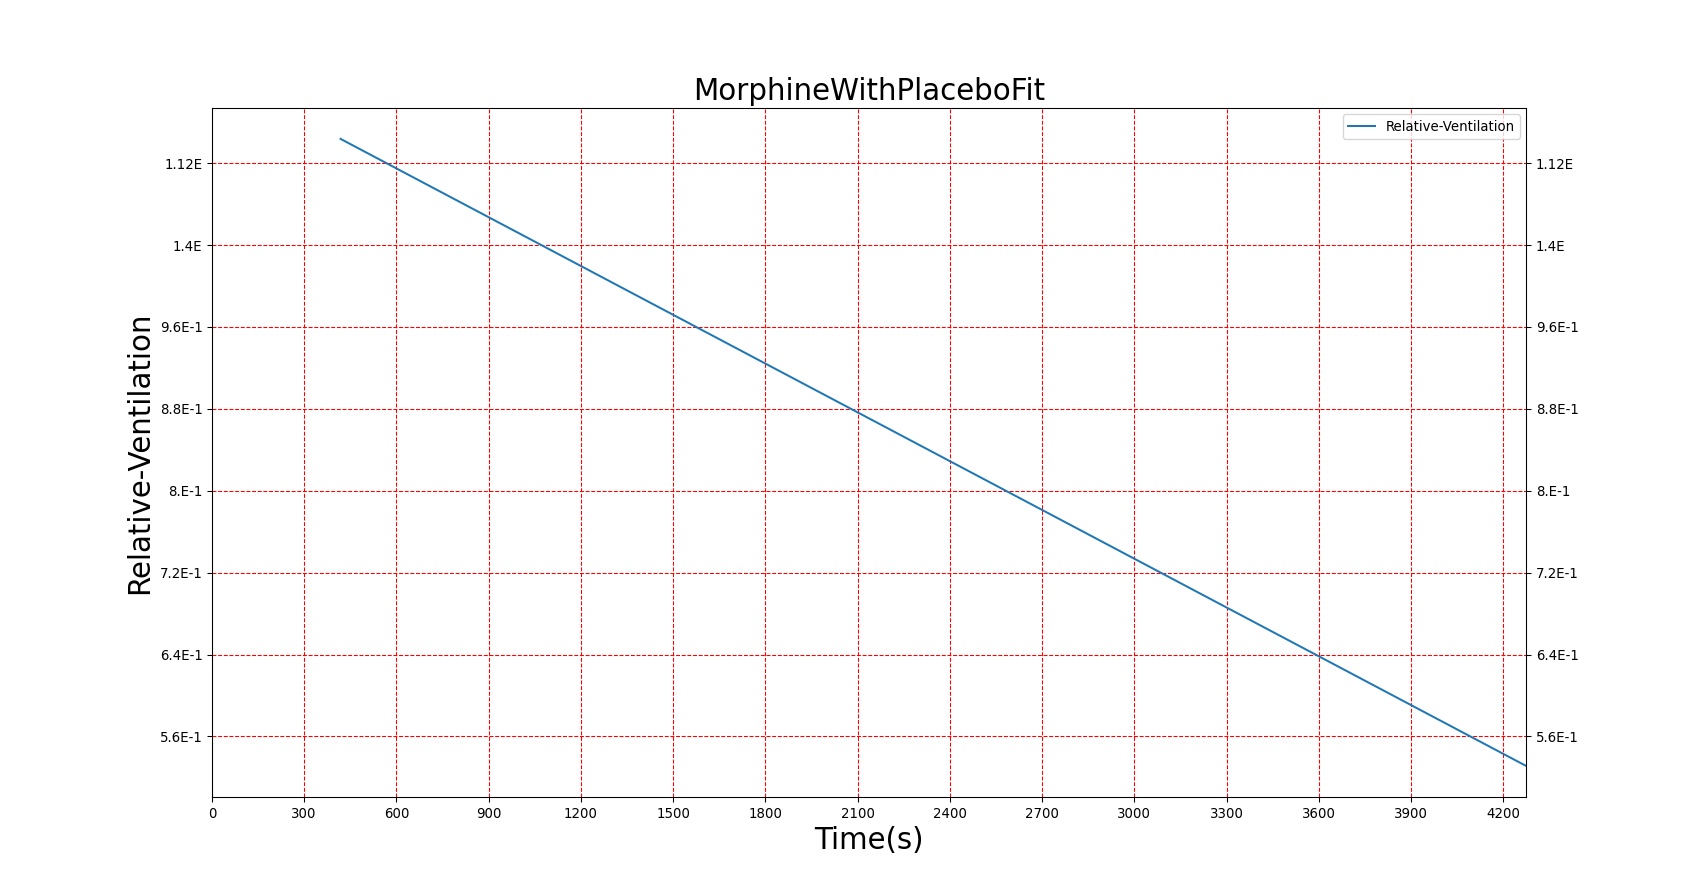
Severe respiratory depression resulting from opioid usage is commonly treated with naloxone. Naloxone competes with opioids at mu receptors in the central nervous system and, when bound, exerts essentially no pharmacodynamic effects [122]. Thus, as more opioids are displaced, symptoms progressively improve. This competitive interaction can be modeled using Equation 10. The inhibition constant (KI) for Naloxone was estimated in two stages (see Figure 22) from data published in [247] regarding the combined effects of Morphine and Naloxone on respiration. First, the EC50 for Morphine was estimated from human volunteers who were administered Morphine followed by placebo. This experimental EC50 was then used to fit Equation 10 to data collected from individuals who were given Morphine followed by Naloxone and determine the best value for KI. Since the EC50 for Morphine utilized by BioGears is not equivalent to the one determined from this study (this is due to the fact that BioGears is tuned for multiple pharmacodynamic responses and not just breathing rate), the ratio of the estimated EC50 to KI was used to determine the BioGears KI. It was assumed that this KI is appropriate for the interaction of Naloxone and Fentanyl, which seems appropriate given that Fentanyl acts predominantly on the same receptor as Morphine.
| 
|
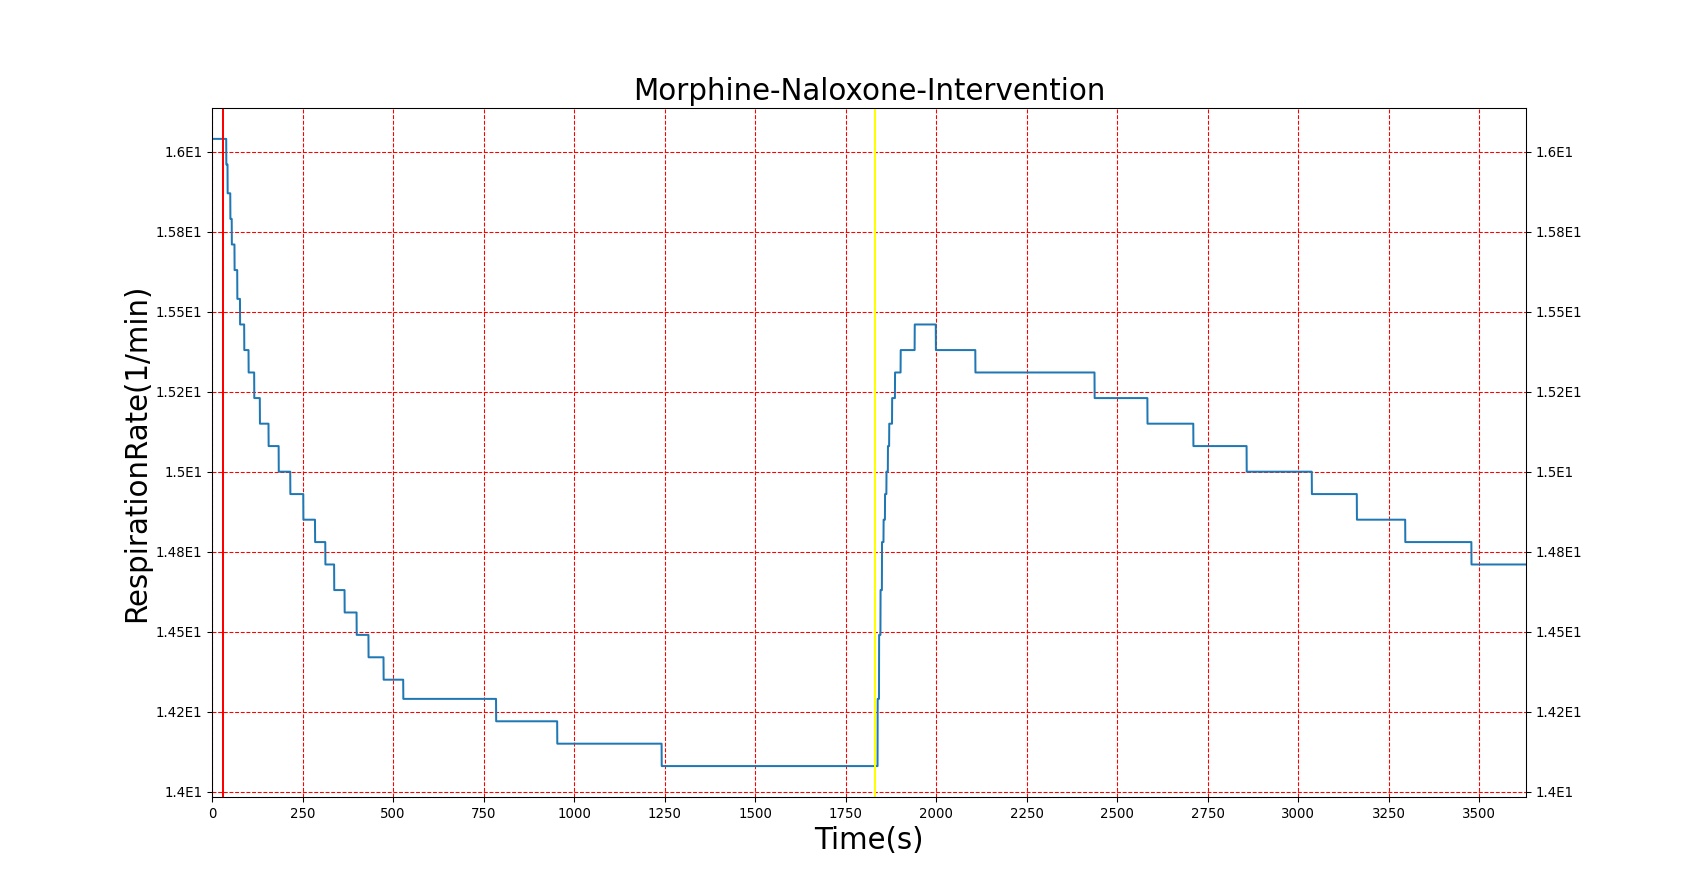
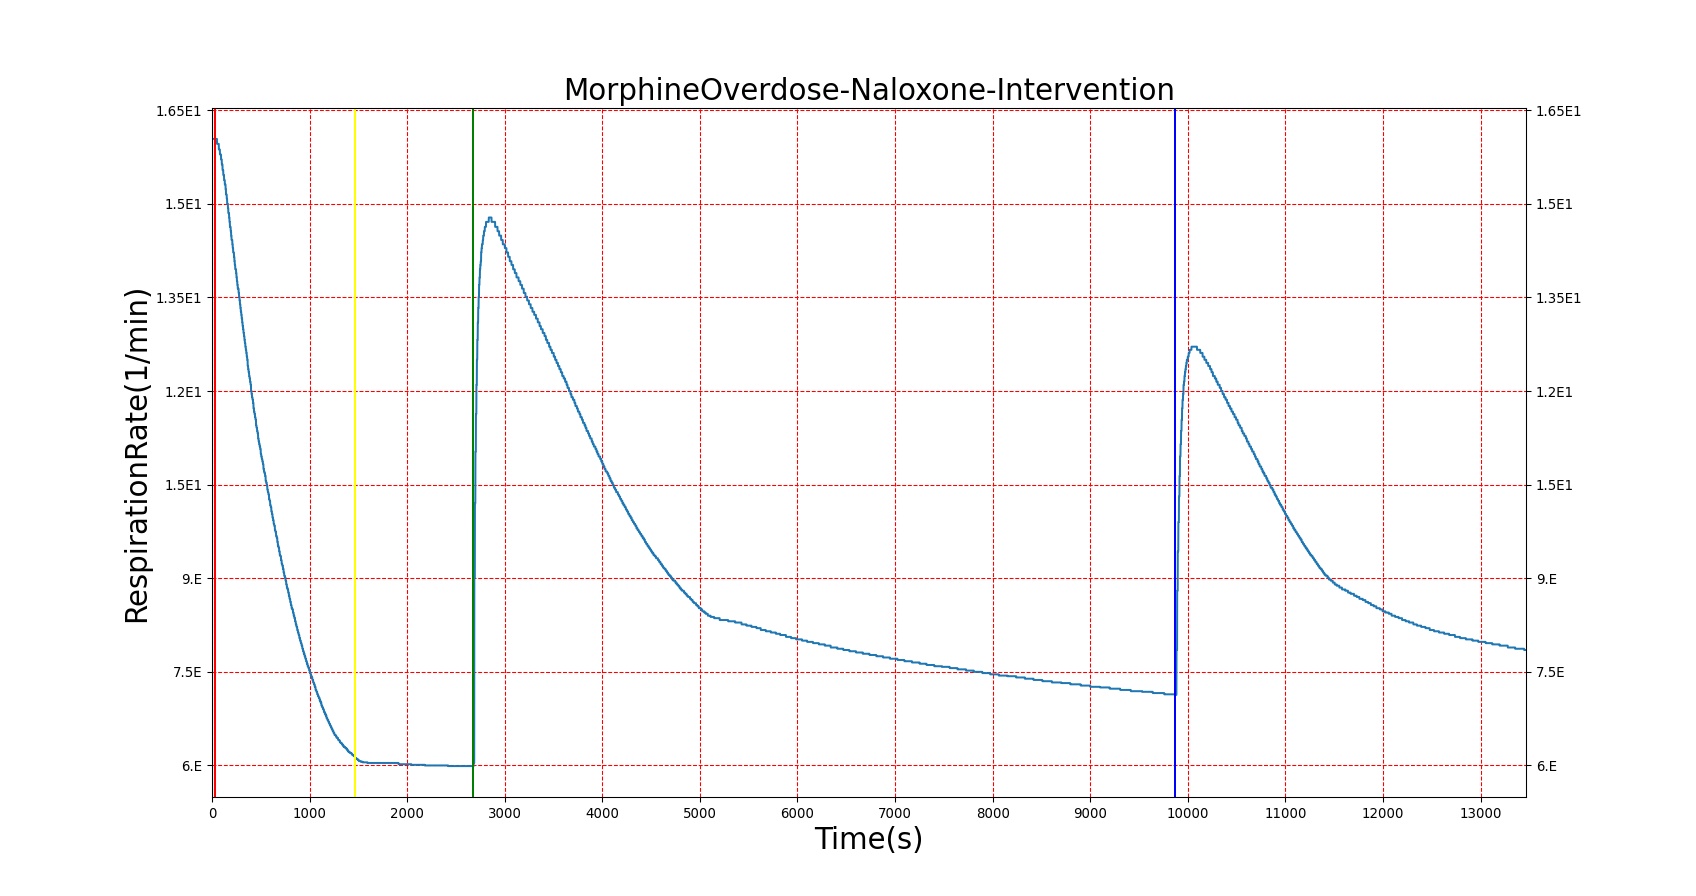
Figures 23-24 demonstrate the effect of administering naloxone after respiratory depression induced by Fentanyl and Morphine. Note that while the effects of Fentanyl are completely reversed after a standard Naloxone dose (115 ug [247]), depression of respiratory activity persists in the case of morphine (renarcotization). In the case of massive overdose, the degree of renarcotization necessitates a second dose of naloxone. This result is due to the fact that Naloxone has a longer elimination half-life than Fentanyl but a significantly shorter one than Morphine (see Table 6 for Naloxone validation).

| 
|
Nerve Gas: Sarin
The Chemical Weapons Convention (CWC) was initiated in 1993 to ban the synthesis of chemical warfare agents and outline a plan for the destruction of existing chemical stockpiles . Though certainly a positive development, chemical weapons, particularly nerve gases, remain of considerable interest due to their potential use as agents of terror. Perhaps the most well-known instance of chemical terrorism is the 1995 attack perpetrated by the extremist group Aum Shinrikyo on the Tokyo subway using the nerve agent Sarin [24]. That same compound, Sarin, has been more recently implicated in chemical attacks in Syria (a relatively new member to the CWC) in 2013 and 2017 [60]. We thus have selected Sarin as our model nerve agent.
Sarin belongs to a class of chemicals called organophosphates which exert their physiological effects by inhibiting the activity of the enzyme acetylcholinesterase. Acetylcholinesterase (AChE) catalyzes the breakdown of the neurotransmitter acetylcholine (ACh) in the peripheral and central nervous systems [26]. In the absence of AChE, ACh remains in high concentrations in synaptic junctions and continues to stimulate nerve signal transduction. Neural overstimulation leads to hyperactivity at receptors associated with muscle tissue, secretory glands, and the respiratory center (though seemingly disparate symptoms can occur as a result of ACh�s role in both the sympathetic and parasympathetic nervous responses) [122]. Prolonged exposure leads to death induced by central respiratory failure and paralysis of diaphragm muscles [26].
To compound matters, the bound Sarin-AChE complex does not spontaneously reverse; rather, it undergoes a subsequent reaction�called �aging��which permanently deactivates AChE [67]. The aging process is the target of efforts to identify organophosphate-induced toxicity reversal agents. If the initial binding of Sarin to AChE can be reversed prior to aging, the functionality of the enzyme can be salvaged and the Sarin eliminated from the body. One class of compounds that has received close attention is the oximes, of which Pralidoxime (2-PAM) is the most frequently cited [194]. As Pralidoxime is also in the BioGears library, we easily incorporate it in our model.
Since it is so toxic at low concentrations, the generic Emax model applied to other BioGears drugs is not readily extendable to Sarin. We instead model the interaction of Sarin with acetylcholinesterase directly. In particular, we describe the binding of Sarin to red blood cell acetylcholinesterase (RBC-AChE). Erythrocyte-bound AChE plays no role in the nervous system and is instead thought to act as a buffer for anti-acetylcholinesterase agents [24]. However, RBC-AChE is easier to assay than neuromuscular AChE and the relative activity of RBC-AChE has been reported to be moderately correlated with organophosphate symptomology [381]. Thus, we can feed the fraction of RBC-AChE inhibited to our pharmacodynamics model. It should be noted that, in practice, high variability in RBC-AChE activity in humans limits the effectiveness of this approach from a diagnostic viewpoint. Symptoms can appear without apparent RBC-AChE inhibition and 100% inhibition can occur with only mild symptoms [381]. However, such a caveat is not as concerning from a pure modeling standpoint.
The kinetic equations governing Sarin inhibition of AChE are given below with the following conventions: S = Sarin, A = acetylcholinesterase (erythrocyte bound), SA = sarin-acetylcholinesterase complex, X = aged (permanently deactivated) AChE, and P = Pralidoxime. Note that Sarin and Pralidoxime clearances are not stated because they are handled by existing BioGears functionality. Also note that Pralidoxime interaction with the Sarin-AChE complex follows Michaelis-Menten kinetics and that the resulting Sarin-Pralidoxime complex is not explicitly tracked. Initial concentrations of all species except RBC-AChE are assumed to be 0. According to the literature, an initial RBC-AChE of 8.0 nM can be expected [24]. Rate constants were obtained from [24], [289], and [125]. The constants ksyn and kdeg, which respectively represent basal synthesis and degradation of RBC-AChE, do not greatly impact the model but are included for completeness. Sarin is assumed to reach the bloodstream via the lungs after inhalation (the most likely route of exposure given the high volatility of Sarin) [290]. The particle-size histogram of aerosolized Sarin was adjusted to achieve a plasma concentration consistent with those observed in animal studies (for more on the methodology of inhaled particles in BioGears, see the Aerosol Section). Sarin is introduced to the simulation via an Environment Change (see Environment Actions).
\[\frac{d[S]}{dt} = -k_{S}*[S][A] \]
\[\frac{d[A]}{dt} = -k_{S}*[S][A]-k_{deg}[A]+k_{syn}+\frac{k_{r}[SA][P]}{K_{D}+[P]} \]
\[\frac{d[SA]}{dt} = k_{S}*[S][A]-k_{age}[SA]-\frac{k_{r}[SA][P]}{K_{D}+[P]} \]
\[\frac{d[X]}{dt} = k_{age}[SA] \]
\[\frac{d[P]}{dt} = -\frac{k_{r}[SA][P]}{K_{D}+[P]} \]
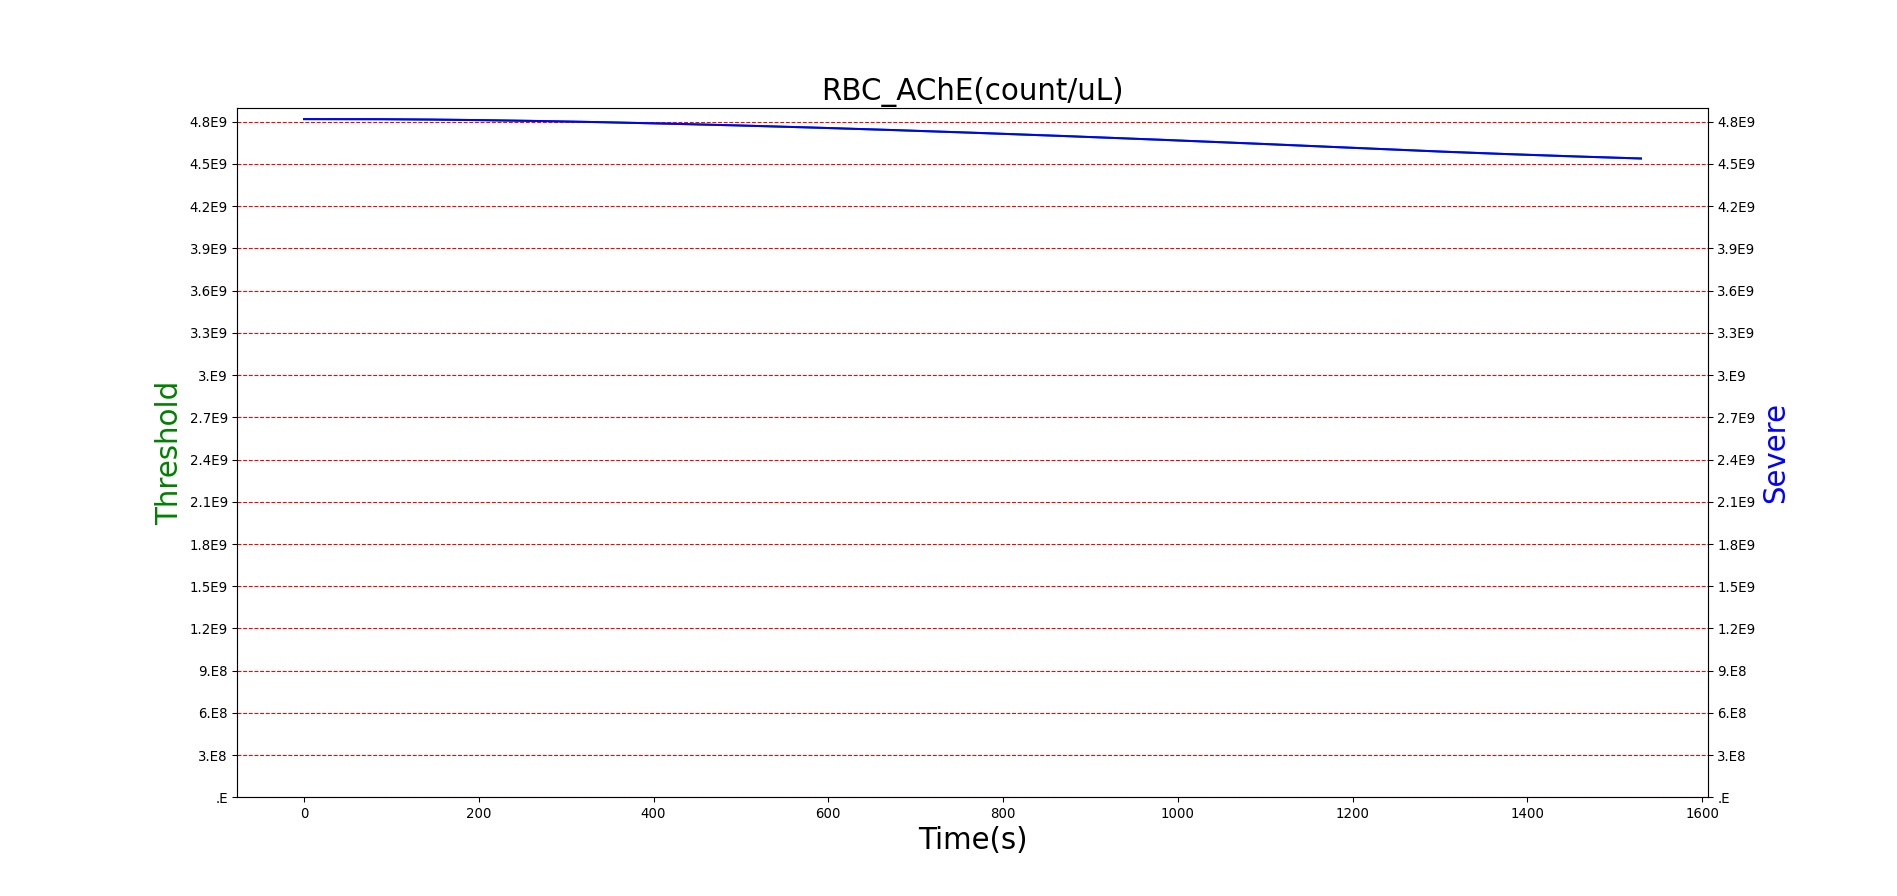
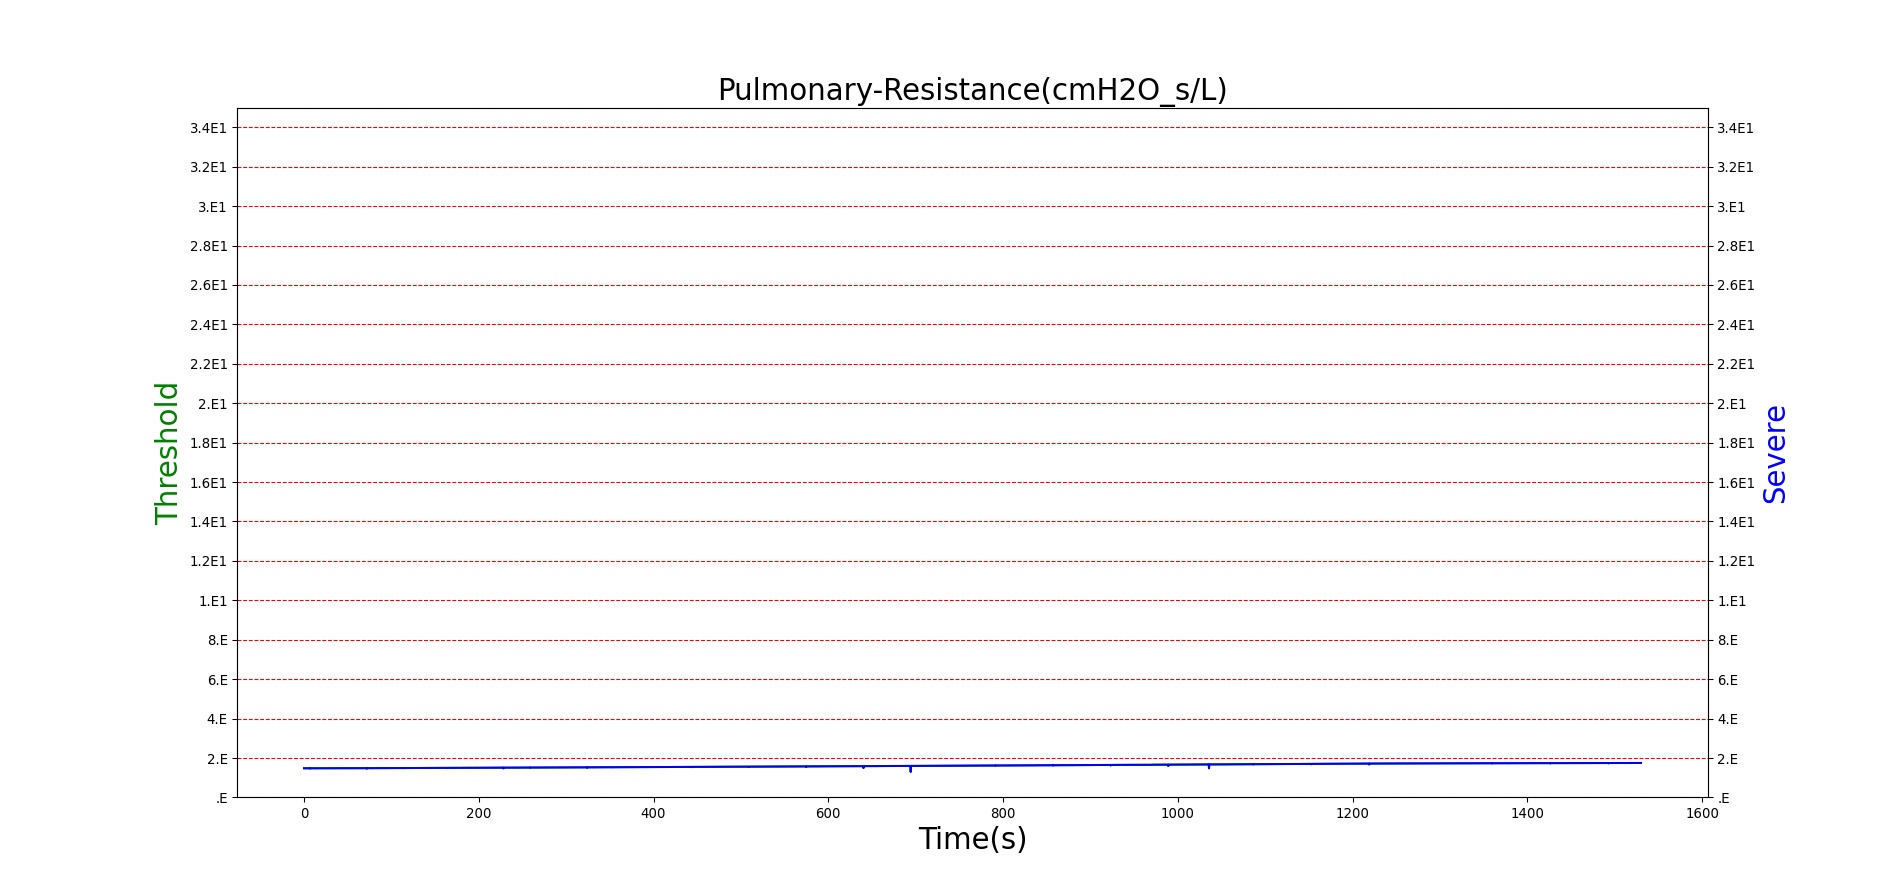
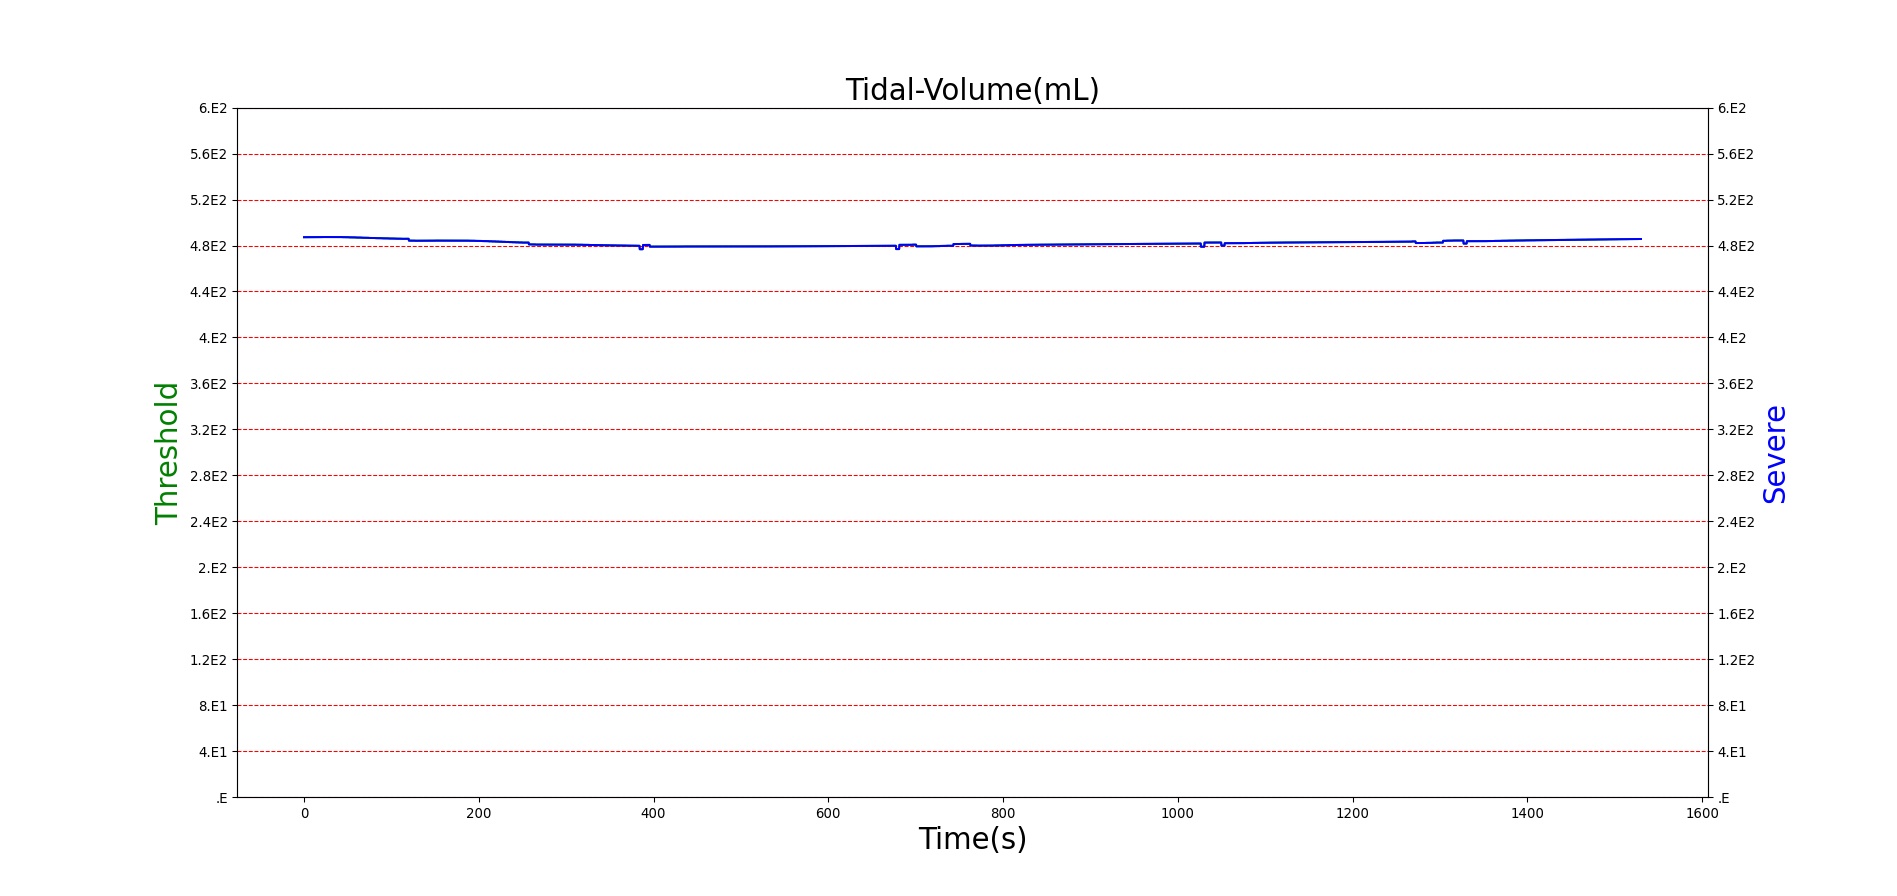
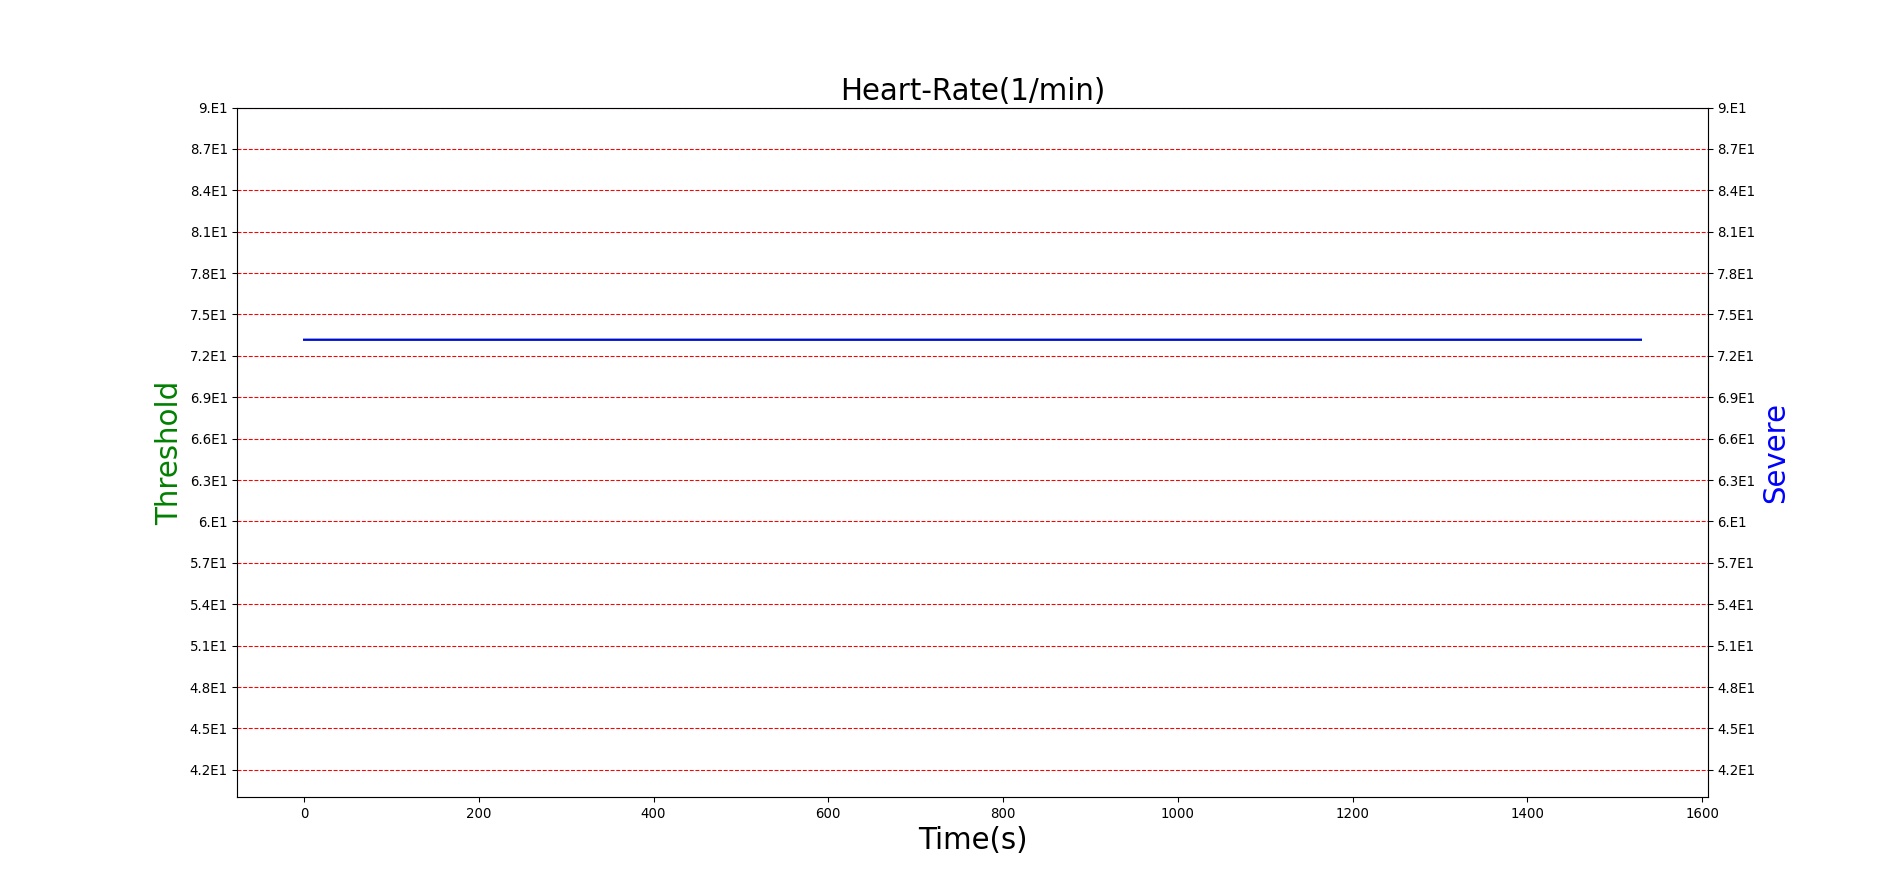
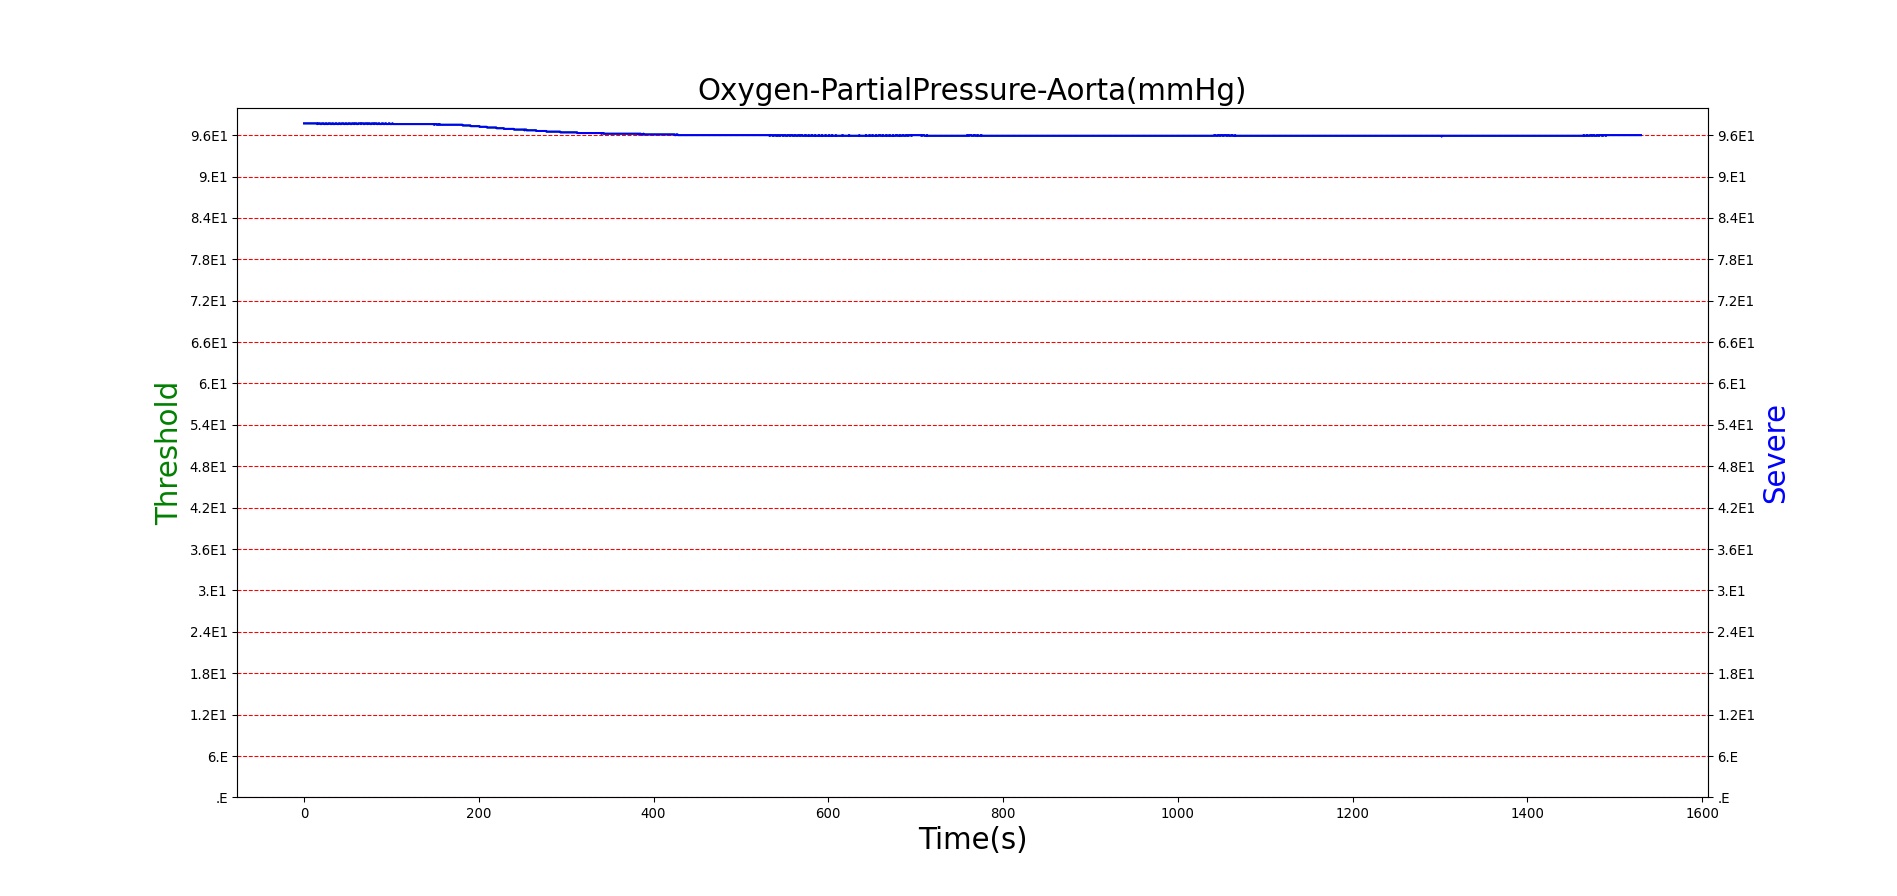
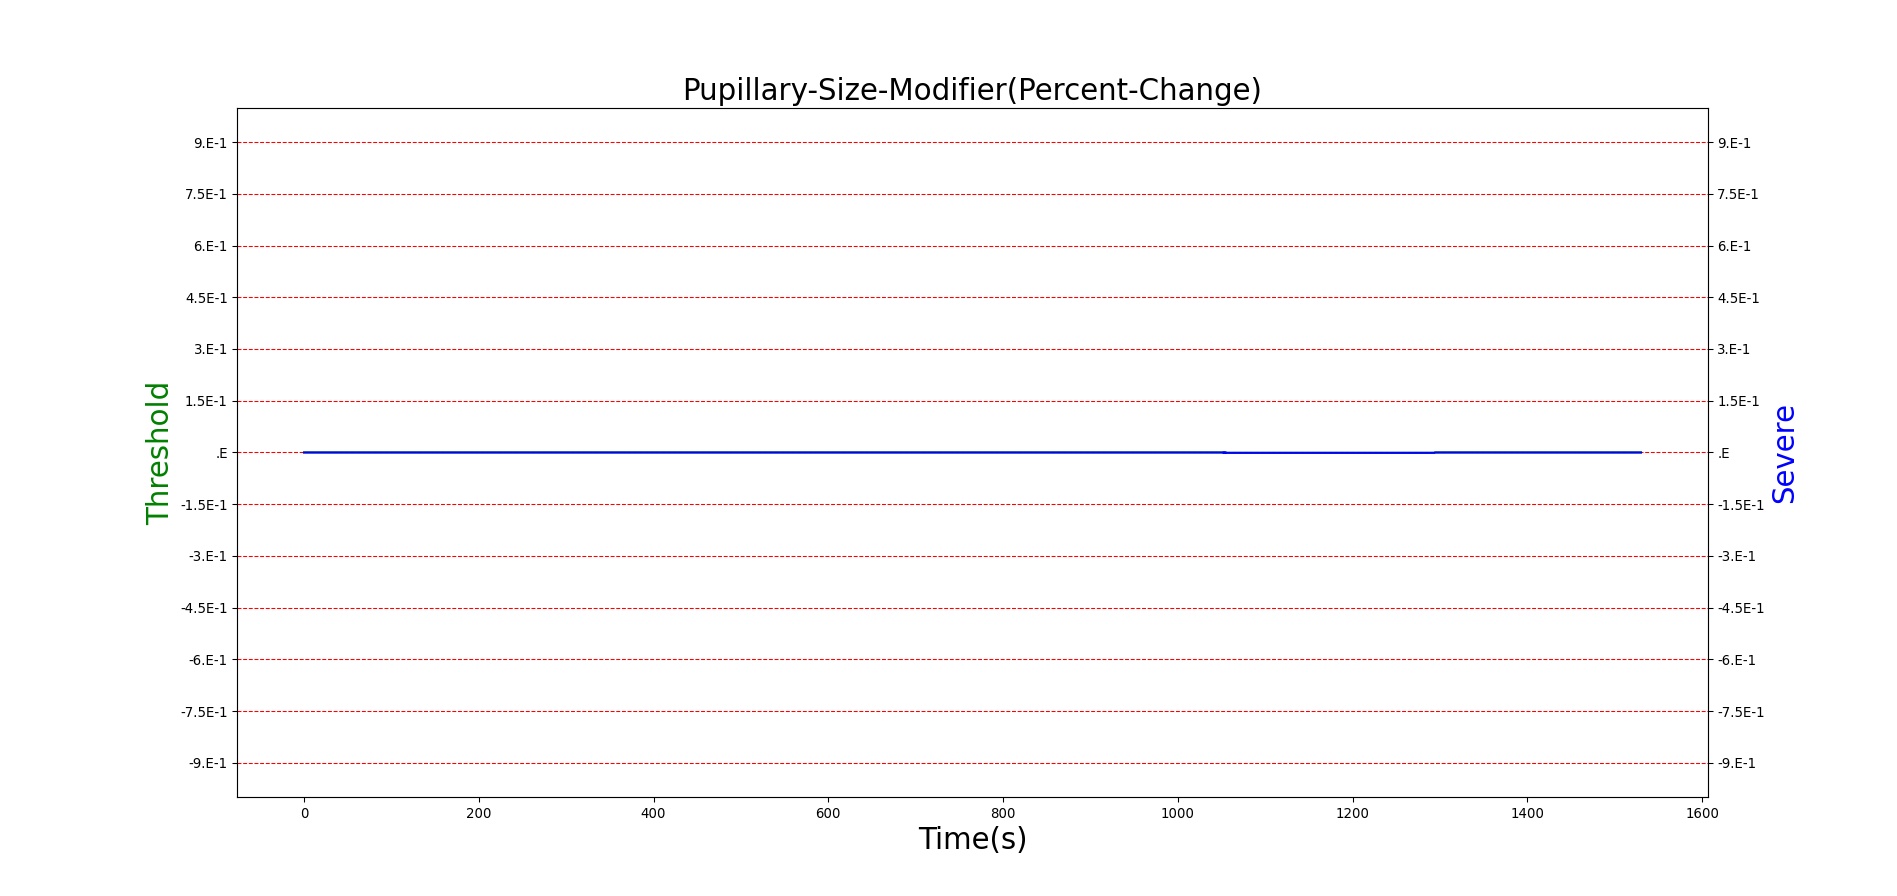
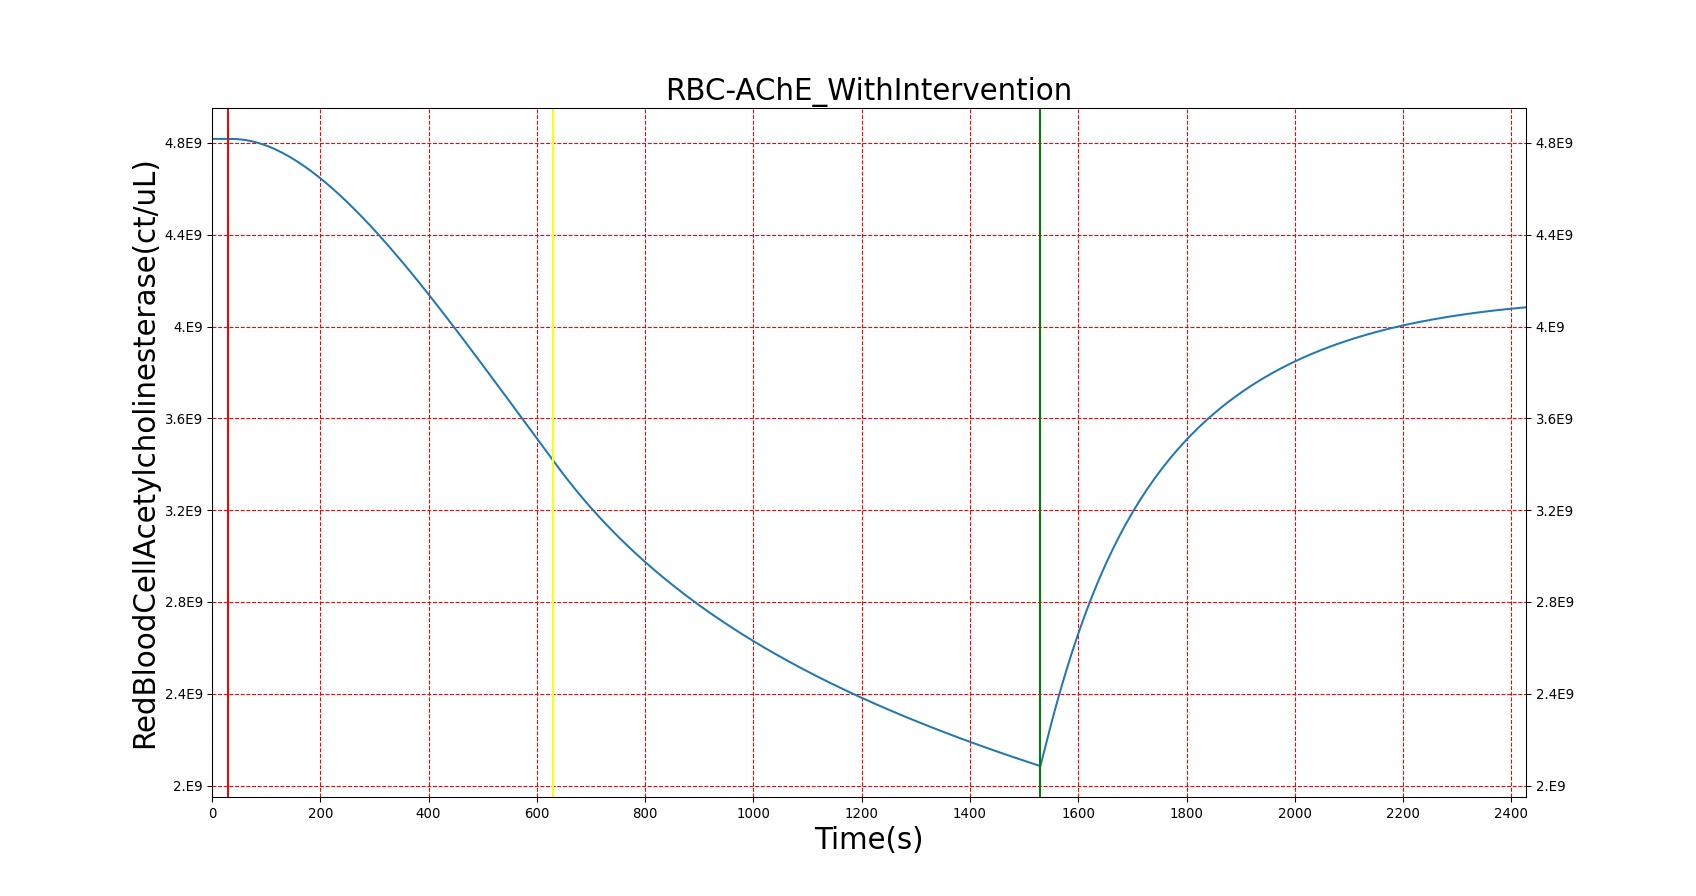
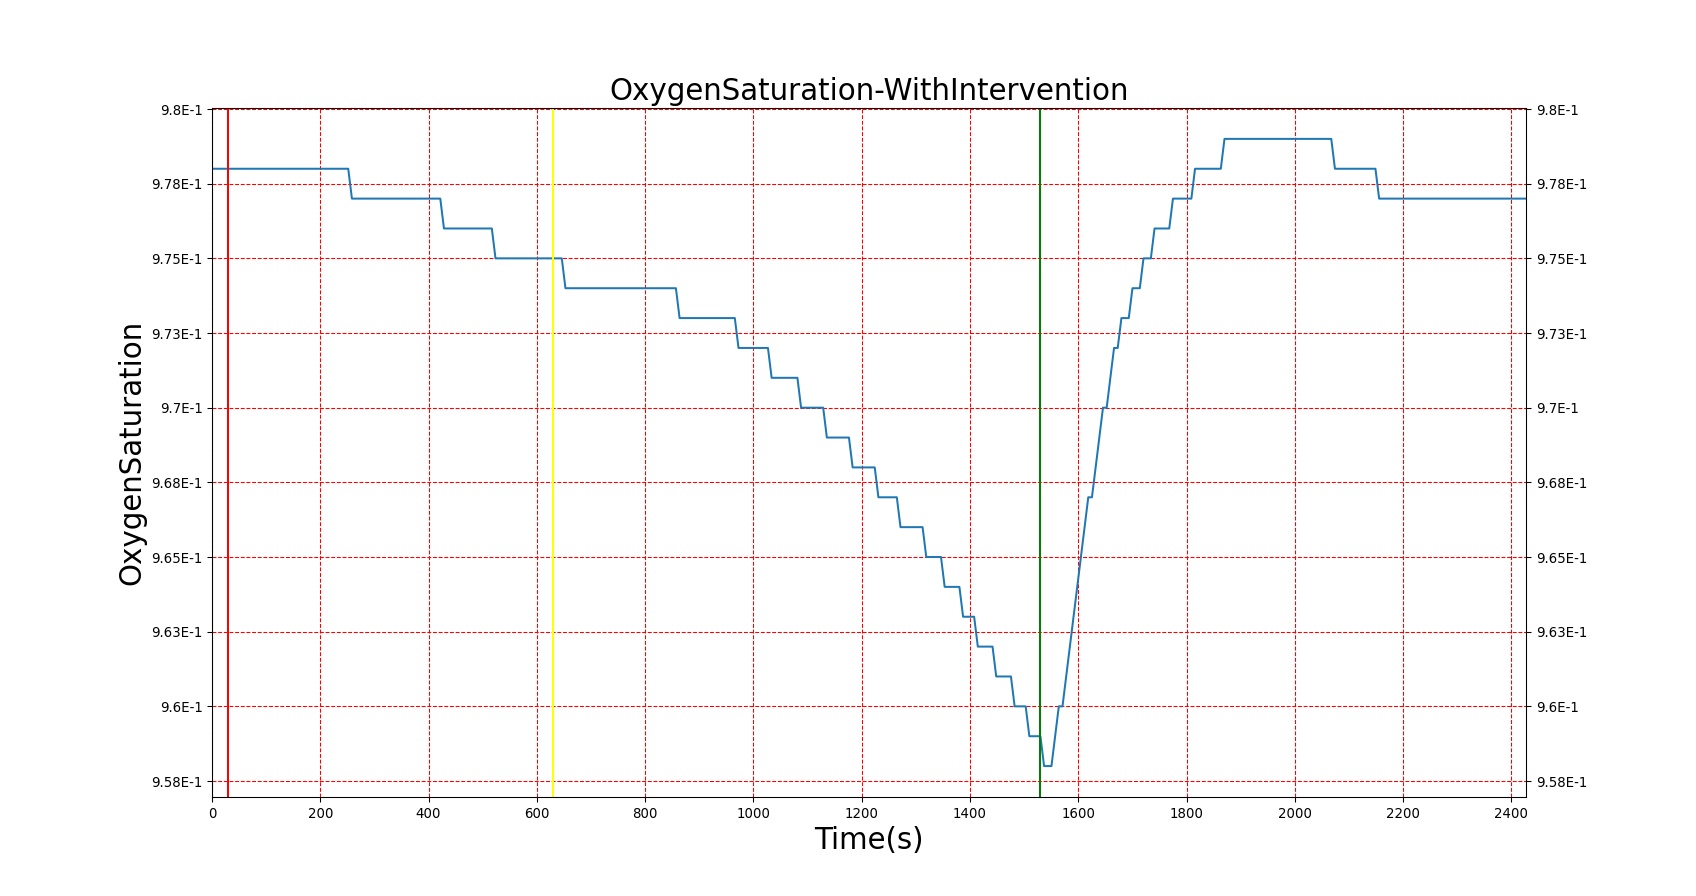
For reasons that are hopefully obvious, the validation metrics for Sarin exposure in humans (Tables 12 and 13) are predominantly qualitative. Estimates for the degree of RBC-AChE inhibition are either extrapolated from studies involving extremely low concentrations or drawn from case studies of accidental exposures. Figure 25 compares the predicted physiological responses to threshold and severe exposures. Figure 26 highlights the RBC-AChE salvaging action of Pralidoxime.
| Scenario | Notes | Occurrence Time (s) | Sampled Scenario Time (s) | Red Blood Cell Acetylcholinesterase Activity | Pupil Size | Respiratory Function | Cardiovascular Function | Blood Chemistry |
|---|---|---|---|---|---|---|---|---|
| Threshold Sarin Aerosol, Concentration = 0.2 mg/m^3 | 20 minute exposure; CT = 4 mg-min/m^3 | 30 | 1200 | Slightly decreased [241] | ~50% diameter reduction [55] | Mild bronchoconstriction [24] | Little to no change [55] | Little to no change [55] |
| Moderate Sarin Aerosol, Concentration (Short) = 5.0 mg/m^3 | 3 minute exposure; CT = 15 mg/m^3 | 30 | 1100 | 40-50% inhibited [24] | > 90% diameter reduction [55] | Respiratory discomfort [323] (quantified by Pulmonary Resistance Increase) | Little to no change | Little to no change |
| Moderate Sarin Aerosol, Concentration (Long) = 0.5 mg/m^3 | 30 minute exposure; CT = 15 mg/m^3 | 30 | 2700 | 40-50% inhibited [24] | > 90% diameter reduction [55] | Respiratory discomfort [323] (quantified by Pulmonary Resistance Increase) | Little to no change | Little to no change |
| Severe Sarin Aerosol, Concentration = 4 mg/m^3 | 10 minute exposure; CT = 40 mg-min/m^3 | 30 | 1500 | 75-80% inhibited [24] | Maximum constriction | Depressed ventilation; decreased tidal volume [416] | Bradycardia and decreased MAP [150] | Increased increased PCO2 and decreased P02 [416] |
| Lethal Sarin Aerosol, Concentration = 15 mg/m^3 | 6 minute exposure; CT = 90 mg-min/m^3 | 30 | 1050 | 100% inhibited | Maximum constriction | Fatal Respiratory Distress [26] | Bradycardia and decreased MAP [150] | Increased PCO2, Decreased PO2 (Hypercapnia & Hypoxia) [416] |
| 
|
| 
|
| 
|
Figure 25. Predicted responses to threshold (red) and severe (blue) exposures to Sarin inhaled from the environment. Note that constriction of the pupils (miosis) occurs even at very low Sarin concentrations. The difference in Pulmonary Resistance is due to deposition of Sarin in the upper respiratory tract, which leads to bronchoconstriction and difficulty breathing. As bronchoconstriction increases, the patient has trouble breathing deeply, resulting in a decrease in tidal volume.
| Action | Notes | Occurrence Time (s) | Sampled Scenario Time (s) | Red Blood Cell Acetylcholinesterase Activity | Pupil Size | Respiratory Function | Cardiovascular Function | Blood Chemistry |
|---|---|---|---|---|---|---|---|---|
| Severe Sarin Aerosol, Concentration = 20 mg/m^3 | 2 minute exposure; CT = 40 mg-min/m^3 | 30 | 1530 | 75-80% inhibited [24] | Maximum constriction | Depressed ventilation; decreased tidal volume [416] | Bradycardia and decreased MAP | Increased increased PCO2 and decreased P02 |
| Pralidoxime 15mg/kg Iv [24] | 1530 | 2430 | Increase in activity [323] | No change | Increased respiration rate [304] | Increased heart rate [304] | Decreased PCO2 and increased PO2 |
| 
|
Figure 26. A severe Sarin exposure (green line = beginning of exposure, black line = end of exposure) followed by administration of 1 g intravenous Pralidoxime (pink line). The red blood cell acetylcholinesterase levels increase, though not to baseline because a fraction of the RBC-AChE still undergoes irreversible aging. The oxygen saturation is shown to demonstrate the positive effect that Pralidoxime has on respiratory function
Conclusions
In general, the drugs in the BioGears library have strong agreement with both the published data and subject matter expertise. The biggest limitation lies in the transient response to drugs. Currently, the system tolerances provide a response within 30–60 seconds for all drugs, regardless of the physiologic onset time. The drug response also wears off quickly for all drugs. It is difficult to specify the desired pharmacodynamic response without a well thought out set of parameters. These issues will be addressed as part of future work on the BioGears Engine by validating the pharmacokinetic model and implementing and validating a pharmacodynamic model.
These models and the combination of these models represent a positive step forward for drug simulation. The parameters are intuitive and accurate for each drug and additional drugs can be added for an expanded drug library.
Future Work
Coming Soon
- Intoxication models for drugs beyond Morphine
- Expanded drug library
- Integration of receptor-based pharmacodynamics
- Multiple types of drug-drug interactions
Recommended Improvements
- Long-term drug effects, including physiological changes
- Additional drugs
- Improved kinetic model for aerosols and vapors
- Higher fidelity models of other routes, including epithelial cell (integumentary, gastrointestinal) absorption
- Drug sensitivity variation
Appendices
Acronyms
MAP - Mean Arterial Pressure
PK - Pharmacokinetic
PD - Pharmacodynamic
SDK - Software Development Kit
SMEs - Subject Matter Experts
Data Model Implementation
Drug


