

Overview
Abstract
The purpose of the BioGears® Blood Chemistry System is primarily to hold the system-level blood substance data. It also uses information about the blood to compute plasma volume and whole-body mass and concentration information. In the future, all blood chemistry computations will take place in the Blood Chemistry system, including the acid-base balance computations of blood gas binding and species distribution that are currently performed by the Saturation class. For this reason, the saturation and acid-base balance models are described in the approach section of this document.
Introduction
The Blood Chemistry system provides a link by which systems and users can access blood substance data. The Blood Chemistry system also processes information about the blood to compute plasma volume and the BioGears Complete Blood Count and Metabolic Panel Assessments.
Although they currently reside in a different class, the blood gas distribution models in the Saturation class are conceptually a part of the Blood Chemistry system. Therefore, models from the Saturation class are described here.
System Design
Background and Scope
The analysis of the blood constituents is critical for assessing physiological function. Respiratory function and acid-base status are assessed by analyzing the distribution of gas species in the blood. Because respiratory, renal, and cardiovascular system functions interact to maintain acid-base homeostasis, abnormal function in any of these systems can cause an acid-base disturbance. For example, respiratory conditions which lead to an increase in the amount of dissolved CO2 in the blood, such as bronchitis, are associated with respiratory acidosis, while metabolic acidosis often accompanies renal pathologies. In order to investigate the origin of an acid-base disturbance, a provider may order a metabolic panel or a complete blood count. These two assessments, along with blood gas analysis, provide a detailed account of the composition of a patient's blood and assist with characterization of acid-base disturbances.
There are three models commonly used for acid-base analysis. One model, often called the Boston model, is relatively simple but relies entirely on the Henderson-Hasselbalch equation. Bicarbonate equilibrium alone, however, is demonstrably insufficient for predicting carbon dioxide species distribution in human blood [402]. To compensate, the Boston model includes six bicarbonate-based rules that are used to assess acid-base status. Another model extends the Boston approach by introducing a new parameter called "base excess" to quantify the metabolic component of an acid-base disturbance [324]. The problem with base-excess is that it is not CO2-invariant in vivo as a result of ionic shifts between the intravascular and interstitial compartments. However, at a constant hemoglobin concentration of 50 g/L, base excess is CO2-invariant when it is computed from measured plasma pH and PCO2. A third model developed by Peter Stewart (and thus called the Stewart approach) describes acid-base balance mechanistically through electrochemical equilibrium dynamics [157].
The Stewart approach has been the subject of criticism. Some researchers have used dilutional acidosis as a model to argue that Stewart's approach does not actually provide any mechanistic insights because "neither the principle of electroneutrality, nor a change in [SID], nor increased H2O dissociation play a mechanistic role" [73]. However, others have noted that the Stewart method "is physicochemically well grounded" and that a dilution of the [SID] is "inevitably a dilution of the buffer base" [177]. Although the Boston model and the Copenhagen model are used more often for clinical, or bedside, analysis of acid-base status, the mechanistic detail of the Stewart model facilitates the computational modeling of acid-base balance and disturbances. We use the Stewart model as the basis for the BioGears acid-base balance model.
Requirements
- Acid-base status
- Respiratory and metabolic acid-base disturbances
Existing
A simple oxygen-hemoglobin binding curve.
Models
Acid-Base and Blood Gas Distribution
The BioGears Blood Chemistry system is the link between compartment-level and system-level blood constituent data. It populates system-level concentration and other data from compartment level data.
Additionally, the blood chemistry computations required to compute acid-base balance and blood gas distribution are performed by the Blood Chemistry system (note that these equations are in the separate Saturation class in the current BioGears engine). The Blood Chemistry system does not adjust mass or concentration of substances independently, but it does adjust concentrations of substance species. For example, the Blood Chemistry system does not adjust the mass or blood concentration of total carbon dioxide (CO2), but it does compute the concentrations of the constituent CO2 species: dissolved CO2, bound CO2, and bicarbonate. That is, the acid-base and hemoglobin saturation models are used to compute the CO2 species distribution. Similarly, the Blood Chemistry system does not change the total amount of oxygen in a compartment, but it does compute how much oxygen is dissolved and how much is bound to hemoglobin.
The BioGears acid-base and blood gas distribution model is based on the Stewart model (discussed above) and the hemoglobin binding model described by Dash and Bassingthwaighte [58]. As outlined by Stewart, the model begins with consideration of electroneutrality. The charge of all strong ions in solution must be zero, as demonstrated by Equation 1.
\[\ \ \left[Na^+\right]+\left[K^+\right]+\left[I^{n+}\right]+\left[Cl^-\right]+\left[La^-\right]+\left[Ket^-\right]+\left[I^{n-}\right]+{\mathrm{[HCO}}^-_{\mathrm{3}}]-\left[A^-\right]\ =0 \]
Note that In,+/- represents the n anions and cations not included in BioGears (All other symbols are defined in Table 6). Some ions, such as carbonate, exist in such minute concentrations that their contribution to electrical neutrality is negligible. These ions are neglected and thus excluded from Equation 1.
It is convenient to define a concentration called strong ion difference [SID], described by Equation 2, which allows Equation 1 to be reduced to Equation 3.
\[[SID]=\left[Na^+\right]+\left[K^+\right]+\left[I^{n+}\right]-\left(\left[Cl^-\right]+\left[La^-\right]+\left[Ket^-\right]+\left[I^{n-}\right]\right) \]
\[[SID]-{\mathrm{[HCO}}^-_{\mathrm{3}}]-[A^-]=0 \]
Equation 4 is an empirical formula for the blood protein anion contribution (A-) developed by Figge et al. [105].
\[\left[A^-\right]=\left[Alb\right]\left(0.123pH-0.631\right)+[Pi](0.309pH-0.469) \]
The Henderson-Hasselbalch equation and equations representing Henry's law for oxygen and carbon dioxide are shown as Equations 5, 6, and 7.
\[pH=6.1+{\mathrm{log} \left(\frac{\left[HCO^-_3\right]}{\alpha P_{CO_2}}\right)\ } \]
\[\left[O_2\right]={\alpha }_{o_2} P_{O_2} \]
\[S_{CO_2}=f\left(pH,P_{O_2},P_{CO_2},T,DPG\right) \]
The above equations are combined into a single expression with three unknowns: bicarbonate concentration, the partial pressure of oxygen, and the partial pressure of carbon dioxide.
\[[SID]-{\mathrm{[HCO}}^-_{\mathrm{3}}]-\left[Alb\right]\left\{0.123 \left(6.1+{\mathrm{log} \left(\frac{\left[HCO^-_3\right]}{\alpha_{O_{2}} P_{CO_2}}\right)\ }\right)-0.631\right\}+[Pi]\left\{0.309 \left(6.1+{\mathrm{log} \left(\frac{\left[HCO^-_3\right]}{\alpha_{CO_{2}} P_{CO_2}}\right)\ }\right)-0.469\right\}=0\]
The conservation of mass requires that the respective amounts of oxygen and carbon dioxide remain constant. Therefore, the sum of dissolved oxygen and hemoglobin-bound oxygen must remain constant. Likewise, the sum of dissolved carbon dioxide, hemoglobin-bound carbon dioxide, and bicarbonate must remain constant. The amount of oxygen or carbon dioxide bound to hemoglobin at a given partial pressure of the gas is defined by the model described in [58]. The binding model and the conservation equations fully define the system, represented by Equation 8 above and Equations 9, 10, 11, and 12 below.
\[[{\mathrm{T}}_{{\mathrm{O}}_{\mathrm{2}}}]=\left(\left[O_2\right]+4 S_{O_2}\left[Hgb\right]\right) \]
\[[{\mathrm{T}}_{{\mathrm{CO}}_{\mathrm{2}}}]=\left(\left[CO_2\right]+\left[HCO^-_3\right]+4{S}_{CO_2}\left[Hgb\right]\right) \]
\[S_{O_2}=f\left(pH,P_{O_2},P_{CO_2},T,DPG\right) \]
\[S_{CO_2}=f\left(pH,P_{O_2},P_{CO_2},T,DPG\right) \]
The blood gas distribution model is used to compute the acid-base status and gas saturation in every cardiovascular compartment at every time slice. This model is used only for intravascular fluid, which is a lumped model of the intra and extracellular fluid spaces within the blood vessels. In BioGears, the extravascular fluid does not contain hemoglobin or any substrate for gases to bind.
Inflammation Model
BioGears maintains an inflammation model that dictates the sytemic response to pathogen invasion, burn wounds, and hemorrhage. The model, which is based on the work of chow2005acute nieman2012two brown2015trauma dominguez2017mathematical, accounts for resting and activated macrophages and neutrophils, pro-inflammatory cytokines (tumor necrosis factor, interleukin-6), anti-inflammatory cytokines (interleukin-10), and free radicals (nitric oxide). The BioGears team has published two articles describing the application of this model to severe burn wounds mcdaniel2019full and sepsis mcdaniel2019whole. These sources can be consulted for model equations and parameters, as well as further detail regarding model integration with the BioGears physiology engine.
Data Flow
Initialize
Compartment-level substance data is initialized by the BioGearsSubstances controller class, and whole-body blood substance data is initialized from the compartment data by the Blood Chemistry system. The constant values of blood density, blood specific heat, plasma fraction of neutral lipid and phospholipid, white blood cell count, phosphate, and strong ion difference concentrations are also initialized by the Blood Chemistry system. Note that the strong ion difference will not be constant following a planned future improvement. The blood chemistry system does not require stabilization. Blood properties are initialized and initial system data is set in the initialization method. System data is populated throughout the engine stabilization process.
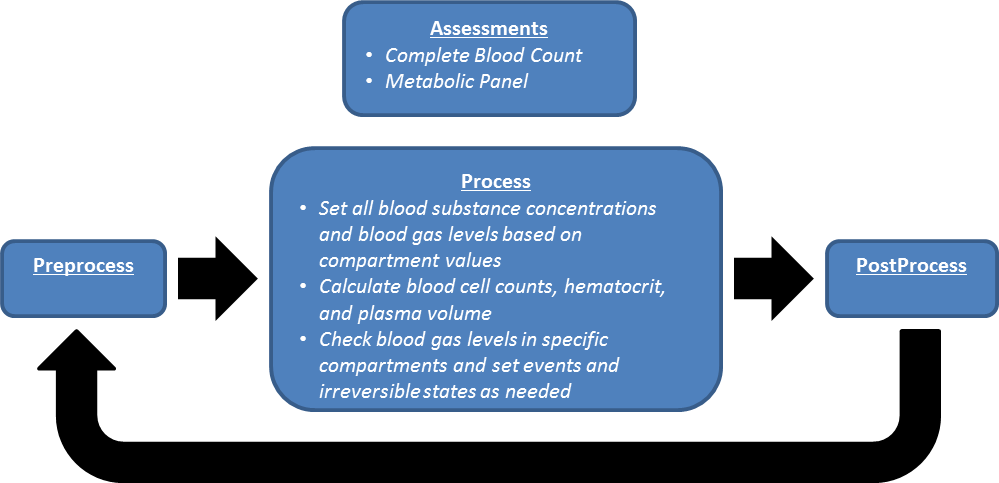
Preprocess
There is no system specific function for Preprocess in Blood Chemistry.
Process
During Process, the blood concentrations, blood gases, and other blood properties that are calculated or changed by other systems are set on the blood chemistry system data objects.
Post Process
There is no system specific function for Post Process in Blood Chemistry.
Assessments
Assessments in BioGears are data collected and packaged to resemble a report or analysis that might be ordered by a physician. There are two BioGears assessments in the Blood Chemistry system: a Metabolic panel and a complete blood count (CBC). The metabolic panel is modeled after the Chem-14 blood test. Currently, eight of the fourteen Chem-14 components are included in the BioGears metabolic panel.
Features and Capabilities
The Blood Chemistry system is a support system primarily for storing and relaying data. Thus, the fidelity of the system is a direct result of the fidelity of the other system models. The concentration of a substance in the blood is computed, typically in a specific compartment or multiple compartments, during the simulation of some process within another system. For example, the blood concentration of sodium is adjusted by the renal system during filtration and clearance and by the tissue system in the compartment diffusion models. The whole-body, system-level blood concentration of sodium is set to the concentration in the vena cava compartment by the Blood Chemistry system.
Some calculations are preformed by the Blood Chemistry system. The red blood cell count, hematocrit, and the plasma volume are calculated here. The red blood cell volume is calculated based on the hemoglobin content of the body (a variable) and the average mass of hemoglobin per red blood cell (currently a constant parameter). The average volume of a red blood cell is then used to calculate the total volume of the red blood cells. The hematocrit is calculated as the ratio of red blood cell volume to total blood volume. The plasma volume is calculated as the total blood volume less the red blood cell volume.
Patient Variability
BioGears substances are initialized in the body by concentration rather than by mass, so morphological variability in patients will have no effect on initial concentrations. However, patient variability does affect physiology, and homeostatic states will vary with patient parameters. For that reason, post-stabilization variance in blood chemistry, including substance concentration, is possible between two different patients. A detailed discussion of patient variability in BioGears is available in the Patient Methodology report.
Outputs
The Blood Chemistry system provides (for circulating substances):
- Blood concentration
- Total mass in blood, tissue, and body
- Pulmonary shunt fraction (fraction of blood bypassing pulmonary oxygenation)
Assumptions and Limitations
Limitations on the Blood Chemistry system are imposed by the supported systems and by the active substances in the simulation. For example, ALT, AST, and ALP are not supported substances, and therefore cannot be included in the metabolic panel assessment.
Additionally, blood cells are not modeled in BioGears. We attempt to account for the contribution of cellular elements to the blood volume, as described above, but white cells and platelets are not included.
Events
Hemolytic Transfusion Reaction (HTR)
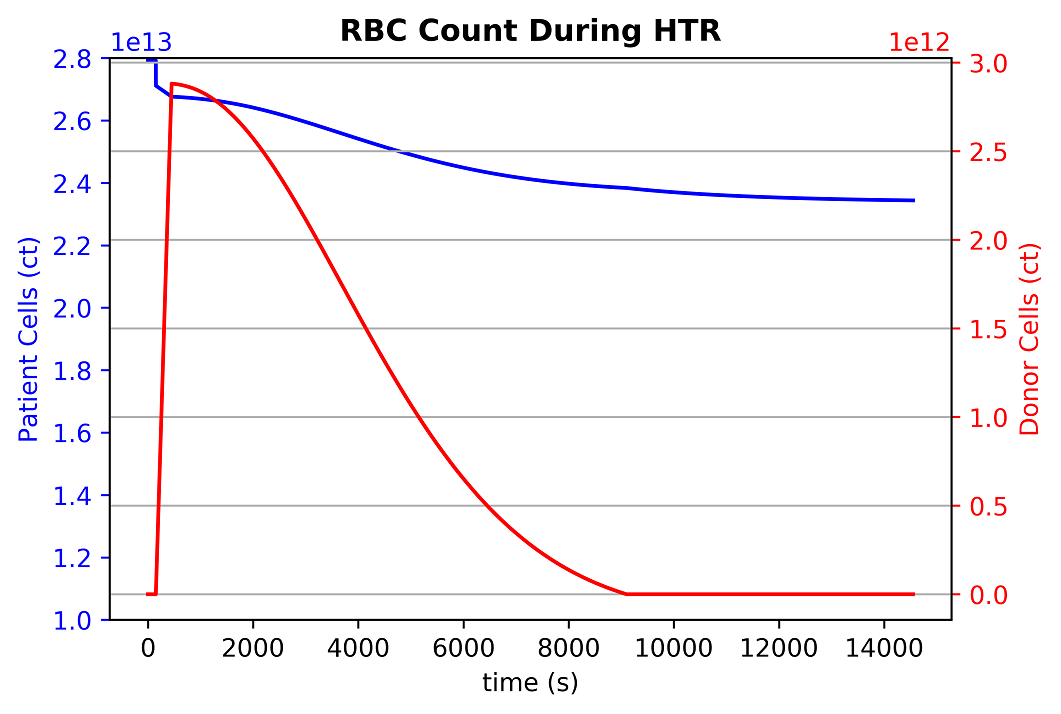
HTR occurs when there is an incompatibility between patient and donor blood blood types [59]. The incompatibility triggers an immune response, resulting in agglutination and red blood cell death in the recipient's body.
The BioGears Engine triggers an HTR event when an incompatibility is detected. This is based both on the set patient's blood type as well as any blood/antigens introduced into their system. This is a reversible condition and is considered resolved when the foreign cells are removed (over time). The time it takes the body to remove foreign cells will depend on the amount introduced. Once kicked off, the event triggers a set of predator-prey equations to model agglutination and clustering of red blood cells. Once cells reach a cluster of four cells, we consider it stable enough to remove the cells in the cluster and remove associated substances. An example reaction showing the infusion of incompatible donor cells and the reaction with patient cells can be seen below:
HTR Equations
\[K\left( {i,j} \right) = \frac{{\left( {{D_i} + {D_j}} \right)\left( {{R_i} + {R_j}} \right)}}{{\left( {4{D_1}{\rm{ }}{R_1}{\rm{ }}} \right)}} \]
\[{C_{\left( {rbc,p} \right)}}\left( {t + 1} \right) = RBC\left( t \right) + \left( {RB{C_{birth}} * dt} \right) - (RB{C_{death}} * dt) - dt(\left( {K\left( {1,1} \right) * RBC\left( t \right) * RB{C_T}\left( t \right)} \right) + \left( {K\left( {2,1} \right) * {C_2}\left( t \right) * RBC\left( t \right)} \right) + (K\left( {3,1} \right) * {C_{3d}}\left( t \right) * RBC\left( t \right))) \]
\[{C_{\left( {rbc,d} \right)}}\left( {t + 1} \right) = RB{C_T}\left( t \right) - (RB{C_{death}} * dt) - dt(\left( {K\left( {1,1} \right) * RBC\left( t \right) * RB{C_T}\left( t \right)} \right) + \left( {K\left( {2,1} \right) * {C_2}\left( t \right) * RB{C_T}\left( t \right)} \right) + (K\left( {3,1} \right) * {C_{3p}}\left( t \right) * RB{C_T}\left( t \right))) \]
\[{C_2}\left( {t + 1} \right) = {C_2}\left( t \right) + dt(\left( {K\left( {1,1} \right) * RBC\left( t \right) * RB{C_T}\left( t \right)} \right) - \left( {K\left( {2,1} \right) * {C_2}\left( t \right) * RBC\left( t \right)} \right) - (K\left( {2,1} \right) * {C_2}(t) * RB{C_T}\left( t \right)) + ((K(2,2) * {C_2}\left( t \right) * {C_2}\left( t \right)))) \]
\[{C_{3,p}}\left( {t + 1} \right) = {C_{3p}}\left( t \right) + dt(\left( {K\left( {2,1} \right) * {C_2}\left( t \right) * RBC\left( t \right)} \right) - \left( {K\left( {3,1} \right) * {C_{3p}}\left( t \right) * RB{C_T}\left( t \right)} \right)) \]
\[{C_{3,d}}\left( {t + 1} \right) = {C_{3d}}\left( t \right) + dt(\left( {K\left( {2,1} \right) * {C_2}\left( t \right) * RB{C_T}\left( t \right)} \right) - \left( {K\left( {3,1} \right) * {C_{3d}}\left( t \right) * RBC\left( t \right)} \right)) \]
\[{C_4}\left( {t + 1} \right) = {C_4}\left( t \right) + dt(\left( {\left( {K\left( {2,2} \right) * {C_2}\left( t \right) * {C_2}\left( t \right)} \right)} \right) + (K\left( {3,1} \right) * {C_{3p}}\left( t \right) * RB{C_T}\left( t \right)) + \left( {K\left( {3,1} \right) * {C_{3p}}\left( t \right) * RBC\left( t \right)} \right)) \]
In the above, D is difussion coefficient, R is radius, RBC is patient red blood cell count, RB{C_T} is transfused red blood cell count, {RB{C_{birth}} and {RB{C_{death}} are the respective birth and death rates of the cell.
Hypercapnia
Hypercapnia occurs when the partial pressure of carbon dioxide in the blood rises to greater than 60 mmHg [134]. Patients with respiratory conditions, such as severe airway obstruction, frequently exhibit hypercapnia. This condition manifests as a decrease in blood pH and an increase in cardiac output, blood pressure, and heart rate.
The BioGears Engine triggers the hypercapnia event when the partial pressure of carbon dioxide in the aorta rises above 60 mmHg. This is a reversible condition and is considered resolved when the partial pressure falls below 57 mmHg. This 3 mmHg window provides a buffer to account for normal fluctuations in the model.
If the partial pressure of carbon dioxide in the blood rises to greater than 80 mmHg, an irreversible state is triggered and it will be impossible to regain homeostasis.
Hypoxia
Hypoxia occurs when the partial pressure of oxygen in the blood falls below 65 mmHg [264]. This can be due to a number of conditions that range from heart failure to poor respiratory function. This condition manifests as a decrease in oxygen saturation, increased heart rate, increased respiratory rate, decreased tidal volume, and pulmonary hypertension.
The BioGears Engine triggers the hypoxia event when the partial pressure of oxygen in the aorta falls below 65 mmHg. This is a reversible condition and is considered resolved when the partial pressure rises above 68 mmHg. This 3 mmHg window provides a buffer to account for normal fluctuations in the model.
If the partial pressure of oxygen in the blood falls below 15 mmHg, an irreversible state is triggered and it will be impossible to regain homeostasis.
Brain Oxygen Deficit
The brain is unable to complete any significant anaerobic metabolism. Therefore, without oxygen in the brain, unconsciousness results within five to ten seconds, and permanent damage can occur within five to ten minutes [134]. Additionally, irreversible damage can occur if the oxygen tension in the brain is too low for a prolonged period of time [70].
There are two events in BioGears related to an oxygen deficit in the brain: Brain Oxygen Deficit and Critical Brain Oxygen Deficit. BioGears triggers the brain oxygen deficit event when the partial pressure of oxygen in the brain drops below 21 mmHg. If the brain remains in this deficit state for 30 minutes, an irreversible state is triggered, and it will be impossible to regain homeostasis (akin to death). If the partial pressure of oxygen in the brain drops below 10 mmHg, the patient enters a critical brain oxygen deficit state, which causes an irreversible state after 10 minutes. If the critical deficit event is active, it is removed when the oxygen partial pressure increases above 12 mmHg, and only the less-critical deficit event will be active. Both deficit events are removed when the oxygen partial pressure returns above 25 mmHg, assuming the irreversible state was never reached. The threshold values are chosen based on empirical data reviewed in summary in [70], and from data presented in [267] and [76].
Myocardium Oxygen Deficit
Blood flow through the coronary arteries provides required oxygen to the heart muscle. If the oxygen supply to the heart is limited through respiratory distress or some other condition, the demand for oxygen will cause dilation of the coronary arteries. By increasing the flow of blood to the heart muscle, the oxygen supply increases [134]. This effect is not currently modeled in BioGears, but the myocardium oxygen level is observed and an event is triggered when it becomes too low. In the future, the resistance to flow in the coronary arteries will be increased to represent blood vessel dilation, and the asystole rhythm change will be tied to the arterial partial pressure of oxygen.
The BioGears Engine triggers the myocardium oxygen deficit event when the partial pressure of oxygen is less than 5 mmHg. If the oxygen level in the heart muscle remains low for more than 40 minutes an irreversible state is triggered and it will be impossible to regain homeostasis.
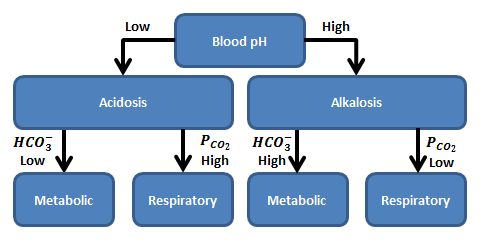
Acid-Base Disturbance Events
Acid-base disturbances can be respiratory or metabolic in origin. When an acid-base disturbance is caused by a change in the total amount of carbon dioxide in the blood, it is considered to be a respiratory disturbance because that system regulates carbon dioxide. If the origin is a change in the strong ion difference, then the disturbance is said to be metabolic in origin. Because the respiratory system responds to a metabolic disturbance and the renal and other systems respond to a respiratory disturbance with compensatory mechanisms, it is difficult to observe a purely metabolic or respiratory disturbance. For that reason, disturbances are sometimes further classified as acute, compensated, and mixed [138]. There are four acid-base disturbance events observed in BioGears.
Metabolic Acidosis
The metabolic acidosis event is triggered when the blood pH drops below the lower bound of the normal range, which is 7.35 for arterial blood (note that the blood pH is sampled from the aorta compartment) [376], and the bicarbonate concentration is less than 22.0 mM. This reversible event is removed when the blood pH increases above 7.38. The small buffer of 0.03 is to allow for numerical fluctuations during transitions. If the blood becomes so acidic that the pH drops below 6.5, an irreversible state is triggered, and it will be impossible to regain homeostasis.
Metabolic Alkalosis
The metabolic alkalosis event is triggered when the blood pH increases above the upper bound of the normal range, which is 7.45 for arterial blood (note that the blood pH is sampled from the aorta compartment) [376], and the bicarbonate concentration is greater than 26.0 mM. This reversible event is removed when the blood pH decreases below 7.42. The small buffer of 0.04 is to allow for numerical fluctuations during transitions. An irreversible state is triggered when the pH increases above 8.5.
Respiratory Acidosis
The respiratory acidosis event is triggered when the blood pH drops below the lower bound of the normal range, which is 7.35 for arterial blood (note that the blood pH is sampled from the aorta compartment) [376], and the partial pressure of carbon dioxide in the arteries is greater than 47.0 mmHg. This reversible event is removed when the blood pH increases above 7.38. The small buffer of 0.03 is to allow for numerical fluctuations during transitions. If the blood becomes so acidic that the pH drops below 6.5, an irreversible state is triggered, and it will be impossible to regain homeostasis.
Respiratory Alkalosis
The respiratory alkalosis event is triggered when the blood pH increases above the upper bound of the normal range, which is 7.45 for arterial blood (note that the blood pH is sampled from the aorta compartment) [376], and the partial pressure of carbon dioxide in the arteries less than 44.0 mmHg. This reversible event is removed when the blood pH decreases below 7.42. The small buffer of 0.04 is to allow for numerical fluctuations during transitions. An irreversible state is triggered when the pH increases above 8.5.
Assessments
Complete Blood Count
A CBC is a blood test that is used to assess a patient’s overall health. It measures several components of the blood including red blood cells, white blood cells, hemoglobin concentration, and hematocrit. When measured, these values can reveal a variety of disorders, including anemia and infection. A complete list of the components of this assessment and the results can be found in the Validation section.
Metabolic Panel
A comprehensive metabolic panel, Chem 14, is a screening assessment used by clinicians to evaluate the overall health of a patient. This assessment can be used to screen for diabetes, liver disease, and kidney disease. This test measures a variety of substance concentrations in the blood, including sodium, protein, calcium, glucose, creatinine, and blood urea nitrogen (BUN). A complete list of the components of this assessment and the results can be found in the Validation section.
Results and Conclusions
Validation - Resting Physiologic State
Published values from the literature were compared to the BioGears Engine output to perform a quantitative validation of the blood chemistry resting physiology. Table 1 shows the validation results. The validation is specified with a color coding system, with green indicating a less than 10% error, yellow indicating a less than 30% error, and red indicating a greater than 30% error when comparing the BioGears output to the published values. All references are noted in the table.
| BloodChemistry | Expected Value | Engine Value | Percent Error | Notes |
|---|---|---|---|---|
| Albumin-BloodConcentration(g/dL) | [4.000000,5.000000][375] | 4.500000 | Within Bounds | |
| ArterialCarbonDioxidePressure(mmHg) | 40.000000[134] | 40.000000 | 0.0% | |
| ArterialOxygenPressure(mmHg) | 95.000000[134] | 97.000000 | 2.083333% | |
| Bicarbonate-BloodConcentration(g/dL) | [0.134000,0.159000][375] | 0.159000 | Outside Bounds | |
| BloodSpecificHeat(J/K_kg) | 3617.000000[95] | 3617.000000 | 0.0% | |
| BloodUreaNitrogenConcentration(mg/dL) | [9.000000,18.000000][375] | 12.300000 | Within Bounds | |
| Calcium-BloodConcentration(mg/L) | [88.160000,104.200000][49] | 95.791551 | Within Bounds | |
| Chloride-BloodConcentration(g/L) | [3.686800,3.864050][49] | 3.863343 | Within Bounds | |
| Creatinine-BloodConcentration(mg/L) | [5.000000,15.000000][375] | 11.080470 | Within Bounds | |
| Epinephrine-BloodConcentration(ug/L) | [0.032000,0.036000][403] | 0.026018 | Outside Bounds | |
| Globulin-BloodConcentration(g/dL) | [2.000000,3.000000][375] | 2.700000 | Within Bounds | |
| Glucose-BloodConcentration(mg/dL) | [70.000000,100.000000][375] | 86.497534 | Within Bounds | |
| Hemoglobin-BloodConcentration(g/dL) | 15.000000[134] | 15.290000 | 1.914823% | |
| HemoglobinContent(g) | [661.500000,835.200000][CHb*Vblood] | 846.000000 | Outside Bounds | |
| Insulin-BloodConcentration(ug/L) | [0.100000,4.760000][376] | 0.722918 | Within Bounds | |
| Ketones-BloodConcentration(mg/L) | [8.167200,10.209000][103] | 10.686793 | Outside Bounds | |
| Lactate-BloodConcentration(mg/L) | [53.442000,151.419000][171] | 78.835375 | Within Bounds | |
| OxygenSaturation | 0.970000[134] | 0.980000 | 1.025641% | |
| Phosphate(mmol/L) | [0.800000,1.400000][376] | 1.100000 | Within Bounds | |
| PlasmaVolume(mL) | 3000.000000[134] | 2989.286452 | 0.357757% | |
| Potassium-BloodConcentration(mg/L) | [108.850000,164.830000][376] | 159.351750 | Within Bounds | |
| PulmonaryArterialCarbonDioxidePressure(mmHg) | 45.000000[134] | 45.000000 | 0.0% | |
| PulmonaryArterialOxygenPressure(mmHg) | 40.000000[134] | 40.000000 | 0.0% | |
| PulmonaryVenousCarbonDioxidePressure(mmHg) | 40.000000[134] | 40.000000 | 0.0% | |
| PulmonaryVenousOxygenPressure(mmHg) | 104.000000[134] | 97.000000 | 6.965174% | |
| PulseOximetry | 0.970000[134] | 0.980000 | 1.025641% | |
| ShuntFraction | [0.020000,0.050000][181] | 0.024000 | Within Bounds | |
| Sodium-BloodConcentration(g/dL) | [0.313000,0.336000][375] | 0.327376 | Within Bounds | |
| StrongIonDifference(mmol/L) | [40.000000,42.000000][157] | 40.500000 | Within Bounds | |
| TotalProteinConcentration(g/dL) | [6.000000,8.000000][375] | 7.000000 | Within Bounds | |
| Triacylglycerol-BloodConcentration(mg/dL) | [50.000000,150.000000][375] | 74.000000 | Within Bounds | |
| Urea-BloodConcentration(mg/dL) | [20.000000,34.000000][230] | 26.300190 | Within Bounds | MW of urea = 60, MW of urea nitrogen = 14x2 => 60/28 = 2.14 |
| VenousCarbonDioxidePressure(mmHg) | 45.000000[134] | 45.000000 | 0.0% | |
| VenousOxygenPressure(mmHg) | 40.000000[134] | 40.000000 | 0.0% | |
| VolumeFractionNeutralLipidInPlasma | 0.002300[286] | 0.002300 | 0.0% | |
| VolumeFractionNeutralPhospholipidInPlasma | 0.001300[286] | 0.001300 | 0.0% |
Overall, the BioGears Engine meets validation, with 37 of the 44 validation parameters having less than a 10% error when compared to published values. An additional two parameters have less than a 30% error. The parameters with greater than 30% error are all related to carbon dioxide saturation and binding in the blood stream. A detailed explanation of how these values are calculated can be found above, with additional information in Tissue. This binding calculation will be reviewed to correct errors in the future.
Validation - Conditions and Actions
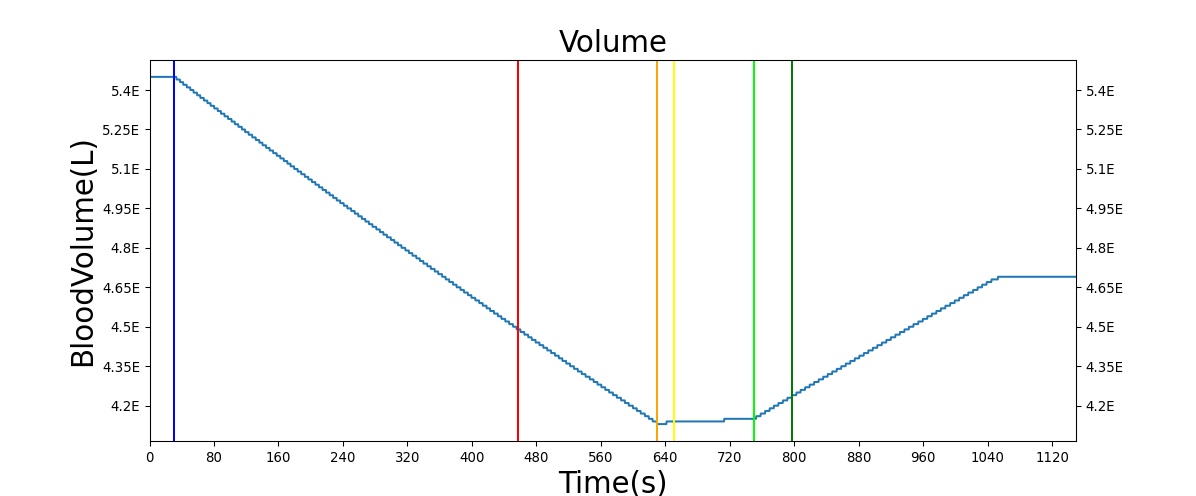
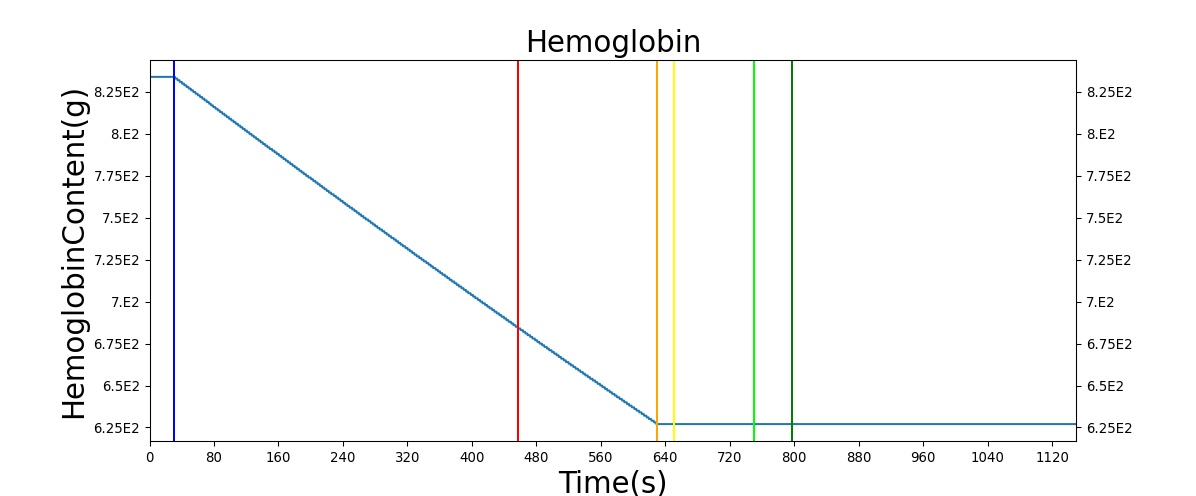
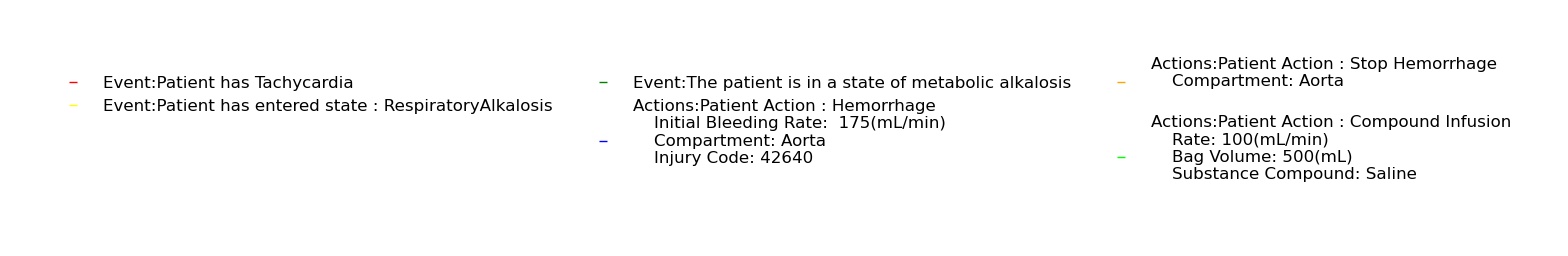
Hemorrhage
The Blood Chemistry system does not have any conditions or actions directly embedded, but the outputs of Blood Chemistry are dependent on the actions and conditions of other systems. An example is the Hemorrhage insult, an action of the Cardiovascular System. Figure 2 shows the effects of hemorrhage and fluid resuscitation with saline on the total blood volume and the total hemoglobin for the patient.
Validation - Assessments
The two assessments in the blood chemistry system provide the outputs associated with a Chem-14 blood panel and a CBC in a single output request from the engine. These assessments were validated with published data, as shown in Table 2 and Table 3. As with the resting physiology, the references for all values are provided and the results are color coded.
| CompleteMetabolicPanel | Expected Value | Engine Value | Percent Error | Notes |
|---|---|---|---|---|
| Albumin(ug/mL) | [4.000000,5.000000][375] | 44982.223987 | Outside Bounds | |
| BUN(ug/mL) | [9.000000,18.000000][375] | 122.707103 | Outside Bounds | |
| CO2(mmol/L) | [22.000000,26.000000][375] | 26.110367 | Outside Bounds | |
| Calcium(ug/mL) | [88.160000,104.200000][49] | 95.158018 | Within Bounds | |
| Chloride(mmol/L) | [102.000000,110.000000][30] | 107.856154 | Within Bounds | |
| Creatinine(ug/mL) | [5.000000,15.000000][375] | 10.966613 | Within Bounds | |
| Glucose(ug/mL) | [65.000000,139.000000][376] | 854.975538 | Outside Bounds | |
| Potassium(mmol/L) | [3.500000,5.500000][nelson2008principles] | 4.083503 | Within Bounds | |
| Sodium(mmol/L) | [136.000000,146.000000][376] | 141.631212 | Within Bounds | |
| TotalProtein(ug/mL) | [6.000000,8.000000][375] | 71971.558380 | Outside Bounds |
| CompleteBloodCount | Expected Value | Engine Value | Percent Error | Notes |
|---|---|---|---|---|
| Hematocrit | 0.420000[134] | 0.460000 | 9.090909% | |
| RedBloodCellCount(ct/uL) | 5200000.000000[134] | 5108178.299783 | 1.781531% | |
| WhiteBloodCellCount(ct/uL) | 7.000000guyton2006medical | 6997.296284 | 199.600245% |
All of the measures in the two Blood Chemistry assessments meet validation.
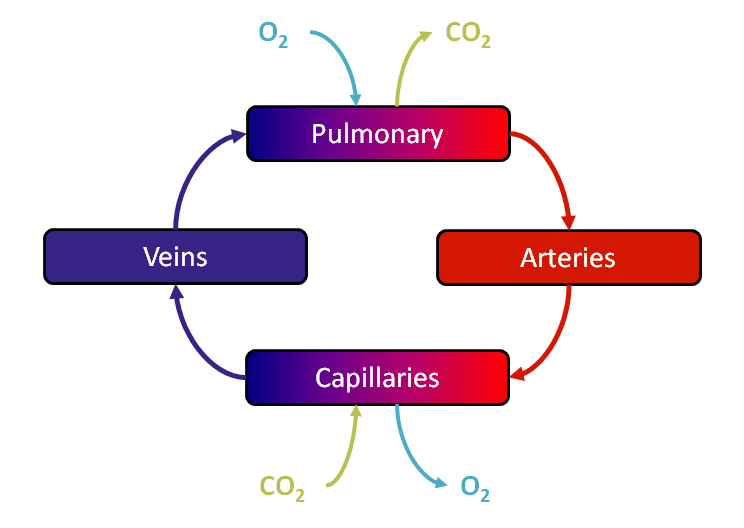
Four Compartment Test
As mentioned above, the Blood Chemistry system serves the primary purpose of storing and relaying information between the other BioGears systems. This heavy reliance on other systems can make it difficult to test the funcitonality of blood gas balance. To this end, the scalability of BioGears was leveraged to create a simpler system comprised of only four compartments: Pulmonary, to represent the capillaries in the lungs where oxygen and carbon dioxide exchange occurs; Arteries, representing all of the oxygen-rich vasculature running to the tissues; Capillaries, representing the location of oxygen removal from the vasculature; and Veins, representing the section of the vasulature containing oxygen-poor blood. A diagram of this simplified system can be seen in Figure 4 below.
Pressures, volumes, and substances were initialized to good values (see Table 4 below), and then the simplified Four Compartment system was run as BioGears would run the normal, complete model using the Preprocess, Process, Postprocess paradigm. In the Preprocess step, oxygen is removed and carbon dioxide is added in the Capillaries to simulate metabolism while oxygen is added and carbon dioxide is removed in the Pulmonary compartment to represent respiration. If a tissue compartment was present, diffusion could also occur in this stage. In the Process step, circuit calculation and substance transport are done. Then, the Postprocess step moves the "Next" values to "Current". For more information about this paradigm, see Circuit Methodology.
| Variable | Initial Value |
|---|---|
| Veins Pressure | 4 mmHg [376] |
| Pulmonary Pressure | 10 mmHg [84] |
| Arteries Pressure | 90 mmHg [376] |
| Capillaries Pressure | 30 mmHg |
| Blood Flow | 5600 mL/min [134] |
| Total Blood Volume | 5 L [134] |
| Arteries Volume | 23% of Total Blood Volume [374] [96] [84] |
| Veins Volume | 60% of Total Blood Volume [374] [96] [84] [85] |
| Pulmonary Volume | 12% of Total Blood Volume [374] [96] [84] |
| Capillaries Volume | 5% of Total Blood Volume [374] [96] [84] |
| Albumin Concentration | 45 g/L [375] |
| Hematocrit | .45 [134] [375] |
| Body Temperature | 37 C [144] |
| [SID] | 40.5 mmol/L [157] |
| Phosphate | 1.1 mmol/L [376] |
| *Pulmonary and Arteries CO2 Saturation | .0282123 |
| *Pulmonary and Arteries O2 Saturation | .974759 |
| *Pulmonary and Arteries CO2 Concentration | 1.30049 mmol/L |
| *Pulmonary and Arteries O2 Concentration | .129065 mmol/L |
| *Pulmonary and Arteries HCO3 Concentration | 25.9377 mmol/L |
| *Pulmonary and Arteries pH | 7.39982 |
| *Capillaries and Veins CO2 Saturation | .162382 |
| *Capillaries and Veins O2 Saturation | .789701 |
| *Capillaries and Veins CO2 Concentration | 1.40557 mmol/L |
| *Capillaries and Veins O2 Concentration | .0560892 mmol/L |
| *Capillaries and Veins HCO3 Concentration | 26.1182 mmol/L |
| *Capillaries and Veins pH | 7.36909 [374] |
| Oxygen Exchange Rate | 5954.2 ug/S [134] |
| Carbon Dioxide Exchange Rate | 6140.4 ug/S [134] |
Because the Four Compartment test is initialized to good values, and because of the design of the BioGears engine and Blood Chemistry system, output values should be within physiological ranges. Indeed, the outputs shown below reflect the proper function of the Blood Chemistry system.
| Variable | Four Compartment Test Ending Value | Valid Value |
|---|---|---|
| Arteries HCO3 | 0.0158445 | [0.134, 0.159] g/dL [375] |
| Arteries CO2 | 41.9369 | 40 mmHg [134] |
| Arteries O2 | 108.012 | 95 mmHg [134] |
| Arteries pH | 7.39498 | 7.2 [374] [7.35, 7.4] [134] |
| Capillaries HCO3 | 0.0159359 | [0.134, 0.159] [375] |
| Capillaries pH | 7.36949 | 7.2 [374] [7.35, 7.4] [134] |
| Pulmonary HCO3 | 0.0158445 | [0.134, 0.159] [375] |
| Pulmonary CO2 | 41.9369 | 40 mmHg [134] |
| Pulmonary O2 | 108.012 | 104 mmHg [134] |
| Pulmonary pH | 7.39498 | 7.2 [374] [7.35, 7.4] [134] |
| Veins HCO3 | 0.0159359 | [0.134, 0.159] [375] |
| Veins CO2 | 44.7292 | 45 mmHg [134] |
| Veins O2 | 39.2399 | 40 mmHg [134] |
| Veins pH | 7.36949 | 7.2 [374] [7.35, 7.4] [134] |
| Total Hemoglobin | 765.0004356 | [661.5, 835.2] g [134] [75] |
Conclusions
The current values output from the Blood Chemistry System provide accurate results for a clinical overview of patient health. Blood gases and hemoglobin (multiple types) are circulated using the transport methodology discussed in the Circuit Methodology and the Tissue Methodology. The Blood Chemistry System is a powerful tool for validation of multiple systems within the BioGears Engine. The system is able to illustrate the dependencies each system has on another, i.e., if the Respiratory System is unable to provide oxygen, a shortage of oxygen in the blood stream results, reducing both the arterial oxygen partial pressure and the oxygen saturation as displayed by the Blood Chemistry system. Future work will focus on adding additional key substances to provide a more complete assessment of a patient's overall health.
Future Work
Coming Soon
Planned improvements to other systems will have an indirect effect on Blood Chemistry. For example, a planned improvement to the vascular tone model in the Cardiovascular system will reduce the resistance of the blood vessels supplying the myocardium, simulating dilation. This improvement to homeostatic feedback will make the BioGears heart muscle more robust to an oxygen deficit, enabling a physiologically accurate threshold for the myocardium hypoxia event. Additionally, major work has already been completed toward a more accurate and complete handling of all substances within the BioGears body. This work will allow for a direct computation of the ion concentrations and the strong ion difference, enabling mechanistic simulation of acid-base disturbances and compensation.
Recommended Improvements
The exclusion of blood cellular elements prohibits the implementation of a variety of mechanistic models of physiologic processes, including coagulation, infectious disease, and hematopoiesis to name a few.
- Inclusion of RBC, platelets, lymphocytes, monocytes, neutrophils, eosinophils, and basophils as blood constituents.
- Adaptive total hemoglobin (for example, increasing hemoglobin with exposure to low-oxygen pressure environments)
- Myoglobin substance models
- Including interactions with oxygen and carbon monoxide
Appendices
Acronyms and Symbols
| Symbol or Acronym | Description |
|---|---|
| A- | The sum of all weak anions that are the conjugate base of all non-volatile weak acids |
| Alb | Albumin |
| ALP | Alkaline Phosphatase |
| ALT | Alanine Aminotransferase |
| AST | Aspartate Aminotransferase |
| Ca2+ | Calcium (strong cation) |
| CBC | Complete Blood Count |
| Cl- | Chloride (strong anion) |
| CO2 | Carbon dioxide gas |
| HCO3- | Bicarbonate |
| Hct | Hematocrit |
| Hgb | Hemoglobin |
| In+ | Represents a lumped set of unnamed cations (e.g. Mg*^{2+}* + Cu*^{2+}* + Fe*^{3+}* + ... ) |
| I^n- | Represents a lumped set of unnamed anions (e.g. sulfate + beta-hydroxybutyrate + ... ) |
| K+ | Potassium (strong cation) |
| Ket- | Ketone body (i.e. acetoacetate, beta-hydroxybutyrate, and acetone) |
| La- | Lactate (strong anion) |
| mmHg | Millimeters Mercury |
| Na+ | Sodium (string cation) |
| O2 | Oxygen gas |
| OH- | Hydroxide ion |
| Pi | Phosphate |
| PCO2 | Partial pressure of carbon dioxide |
| PO2 | Partial pressure of oxygen |
| pH | Negative log of the hydrogen ion concentration |
| SCO2 | Fraction of hemoglobin binding sites with a bound carbon dioxide molecule |
| SO2 | Fraction of hemoglobin binding sites with a bound oxygen molecule |
| SID | Strong Ion Difference, defined as [SID] = [strong cations] - [strong anions] |
| T | Temperature |
| TCO2 | Total carbon dioxide |
| TO2 | Total oxygen |
| αCO2 | The plasma CO_2 solubility coefficient |
| αO2 | The plasma O_2 solubility coefficient |
Data Model Implementation
BloodChemistry


