

Overview
Abstract
The BioGears® Energy system provides a methodology for both thermal and metabolic regulation within the body. Heat transfer is modeled by a body thermal circuit that is connected to the environment circuit. A heat source at the core of the body circuit represents the metabolic heat production. In addition to generating heat, the dynamic metabolic rate is also used to compute the metabolic production and consumption rates of gases and other substances in the body. This system has been validated both under resting and dynamic conditions, such as exercise and external environment changes.
Introduction
The Energy system is responsible for simulating metabolism and regulating internal temperature. Metabolism is simulated through the consumption of nutrients in the tissues. Glucose and fat are the nutrients most readily used as an energy source for the human body. Oxygen is used to metabolize these nutrients during aerobic metabolism. After entering the pulmonary capillaries, oxygen is transported via the circulatory system and diffuses into the tissue where it is used in the aerobic reaction. The resulting by-product, carbon dioxide, diffuses out of tissue, traveling through the circulation before exiting the body through the pulmonary capillaries [134]. Glucose can also be used to produce energy under anaerobic conditions, and lactate (lactic acid) is the resulting by-product. The lactate enters the circulation and can be reconverted to glucose via gluconeogenesis in the liver and kidneys. During periods of prolonged starvation, the liver produces ketones. Acetoacetate is the predominant ketone synthesized. After it is produced, acetoacetate may be used as an energy source for the brain, myocardium, and muscle [128].
The body's temperature is well-regulated. Core temperature regulation can be achieved by varying heat production (e.g. shivering) or heat exchange (e.g. sweating). In BioGears, variations in the external environment or physical activity can lead to changes in the core temperature, triggering thermal feedback. Examples of thermal feedback during shifts in core temperature are sweating and shivering. Sweating is initiated if the core temperature is too high [144]. The increased evaporation of water from the surface of the skin leads to an increase in heat transferred out of the body. Changes in core temperature directly affect other systems. For example, a low core temperature causes blood flow to be shunted away from the skin, resulting in less heat transfer from the core to the skin [134]. These feedback mechanisms are used to maintain thermal homeostasis in a variety of environmental conditions.
System Design
Background and Scope
Requirements
The BioGears energy system is required to simulate the effects of exercise and elevated physical activity as well as react to temperature and pressure changes in the environment.
Approach
The BioGears Energy system is a physical model of heat transfer combined with a collection of empirical equations for heat production and exchange obtained from literature. Additional equations are derived from stoichiometric relationships and empirical data found in the literature, particularly the governing equations for the metabolic production and consumption of substances. It uses a thermal circuit to simulate heat transfer through the body, with the body circuit connected to the environment circuit. The body thermal circuit consists of a core node, representing core temperature, and a skin node, which represents the lumped peripheral temperature. The body thermal circuit is shown in Figure 1.
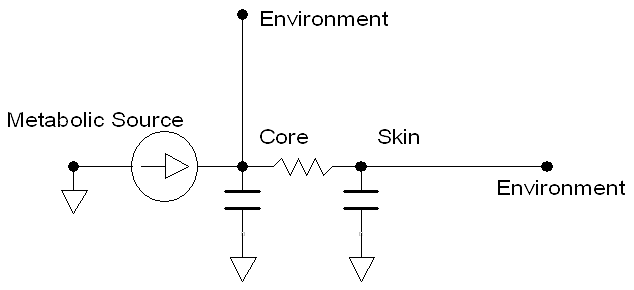
The path elements consist of an internal heat flow source, a core heat capacitance, a skin heat capacitance, and a variable resistor from the core to skin. These four elements represent metabolic heat generation, the discretized heat capacity of the human body, and the convective heat transfer due to blood flow. The heat capacities of the core and skin are computed by proportioning the mass-averaged heat capacity found in literature based on the mass fraction of the skin [144]. The variable core to skin resistance is computed dynamically during simulation, and is inversely proportional to the skin blood flow. A decrease in blood flow leads to an increase in heat transfer resistance, and vice versa. When connected to the environment thermal circuit, the core and skin temperatures dynamically react to the environmental conditions (e.g. temperature, pressure, and humidity).
The metabolic production and consumption of the Energy system is determined by the rate of change of substances (nutrients, ions, gases) in the tissue, relying on advective and diffusive transport methodologies.
Thermal Regulation
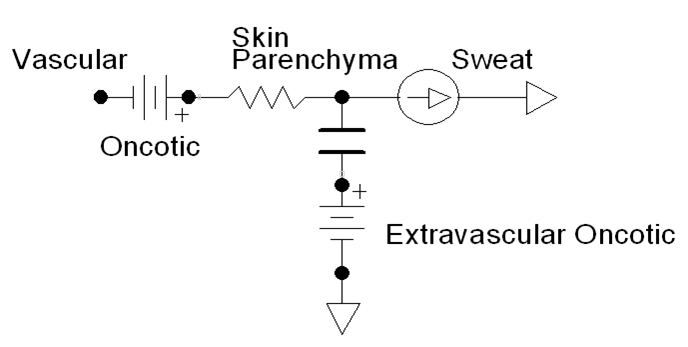
Thermal regulation in the Energy system occurs through manipulation of the metabolic rate or through external losses (sweating). The thermal feedback mechanisms are a direct implementation of those discussed by Herman [144]. For high core temperature, a control equation specifies the sweat rate as a function of the difference between the current core temperature and the set-point (Equation 1). Sweat is removed from the body via a path connected between the skin and the environment (Figure 2).
\[ \dot{m}_{sweat} = \frac{h_{sweat} \left(T_{core} - T_{core,setpoint} \right)}{\rho_{sweat}} \]
For severe increases in core temperature (hyperthermia), the rate of chemical reactions can increase, leading to a subsequent rise in metabolic rate. This value was quantified from Pate et al. [196] as an eleven percent increase in metabolic rate for every degree increase in core temperature. This is described from the power relationship between metabolic rate and core temperature, shown in Equation 2.
\[ \dot{Q}^{n+1}_{metabolic} = \dot{Q}^{n}_{metabolic} * \left(1.11 \right)^{T_{core}-T_{core,high}} \]
For low core temperatures, the maximum metabolic rate achievable through shivering is defined from the summit metabolism. This value is given by Herman as:
\[ \dot{Q}_{metabolic} = 21.0m^{0.75}_{b} \]
If the summit metabolism is not enough to adequately maintain internal temperature, then the metabolic rate will begin to decrease at a rate of four percent for every degree drop [201]. The power relationship in Equation 4 is used to describe this phenomenon.
\[ \dot{Q}^{n+1}_{metabolic} = \dot{Q}^{n}_{metabolic} * \left(0.96 \right)^{T_{core,low}-T_{core}} \]
Under resting conditions, the metabolic rate is determined from the Harris-Benedict formula. This formula gives the metabolic requirements in kilo-calories per day as a function of weight, height, age, and sex [300] . This empirical formula is shown in Equation 5.
| Men: | \[ \dot{Q}_{metabolic} = 88.632 + 13.397*m_{b} + 4.799*H - 5.677*A \] |
| Women: | \[ \dot{Q}_{metabolic} = 447.593 + 9.247*m_{b} + 3.098*H - 4.330*A \] |
Data Flow
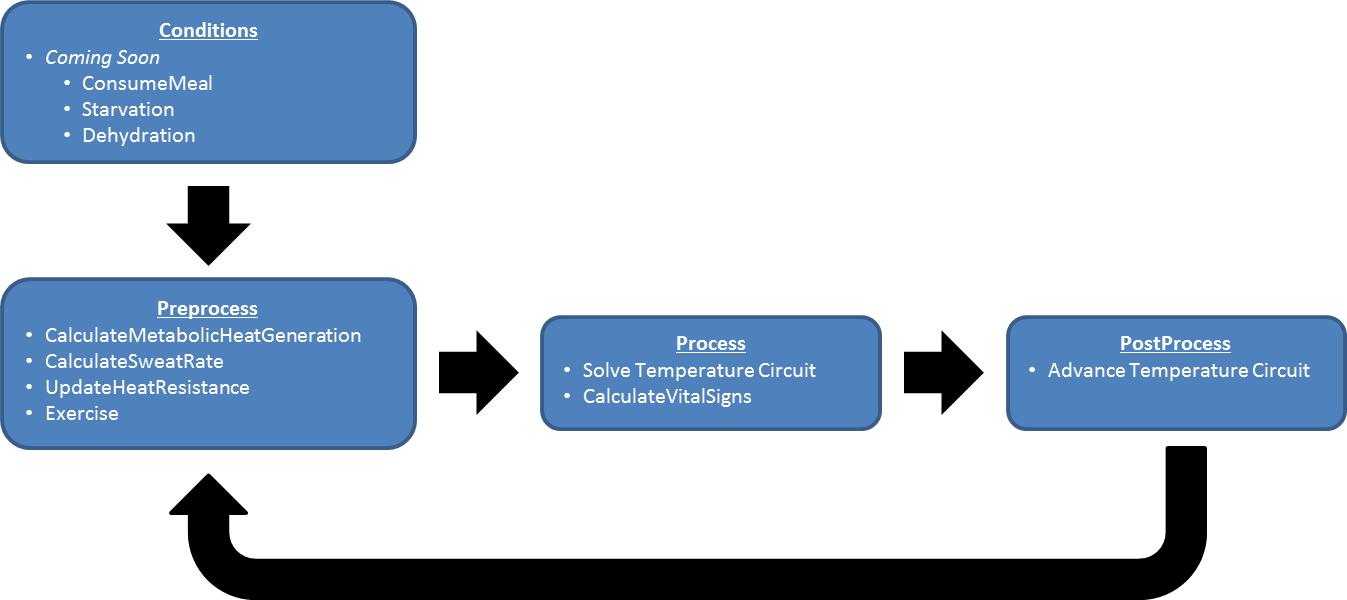
The Energy System determines its state at every timestep through a three-step process: Preprocess, Process, and Postprocess. In general, Preprocess determines the circuit element values based on feedback mechanisms and engine settings/actions. Process uses the generic circuit calculator to compute the entire state of the circuit and fill in all pertinent values. Postprocess is used to advance time.
Preprocess
Calculate Metabolic Heat Generation
The metabolic rate is dictated by the current state of the core temperature. This function includes states of increased metabolic rate due to shivering or severe hyperthermia. Additionally, an extreme drop in core temperature leads to decreasing metabolic rate. If the core temperature does not meet any of the criteria for increases/decreases, the metabolic rate will be calculated as the basal metabolic rate.
Calculate Sweat Rate
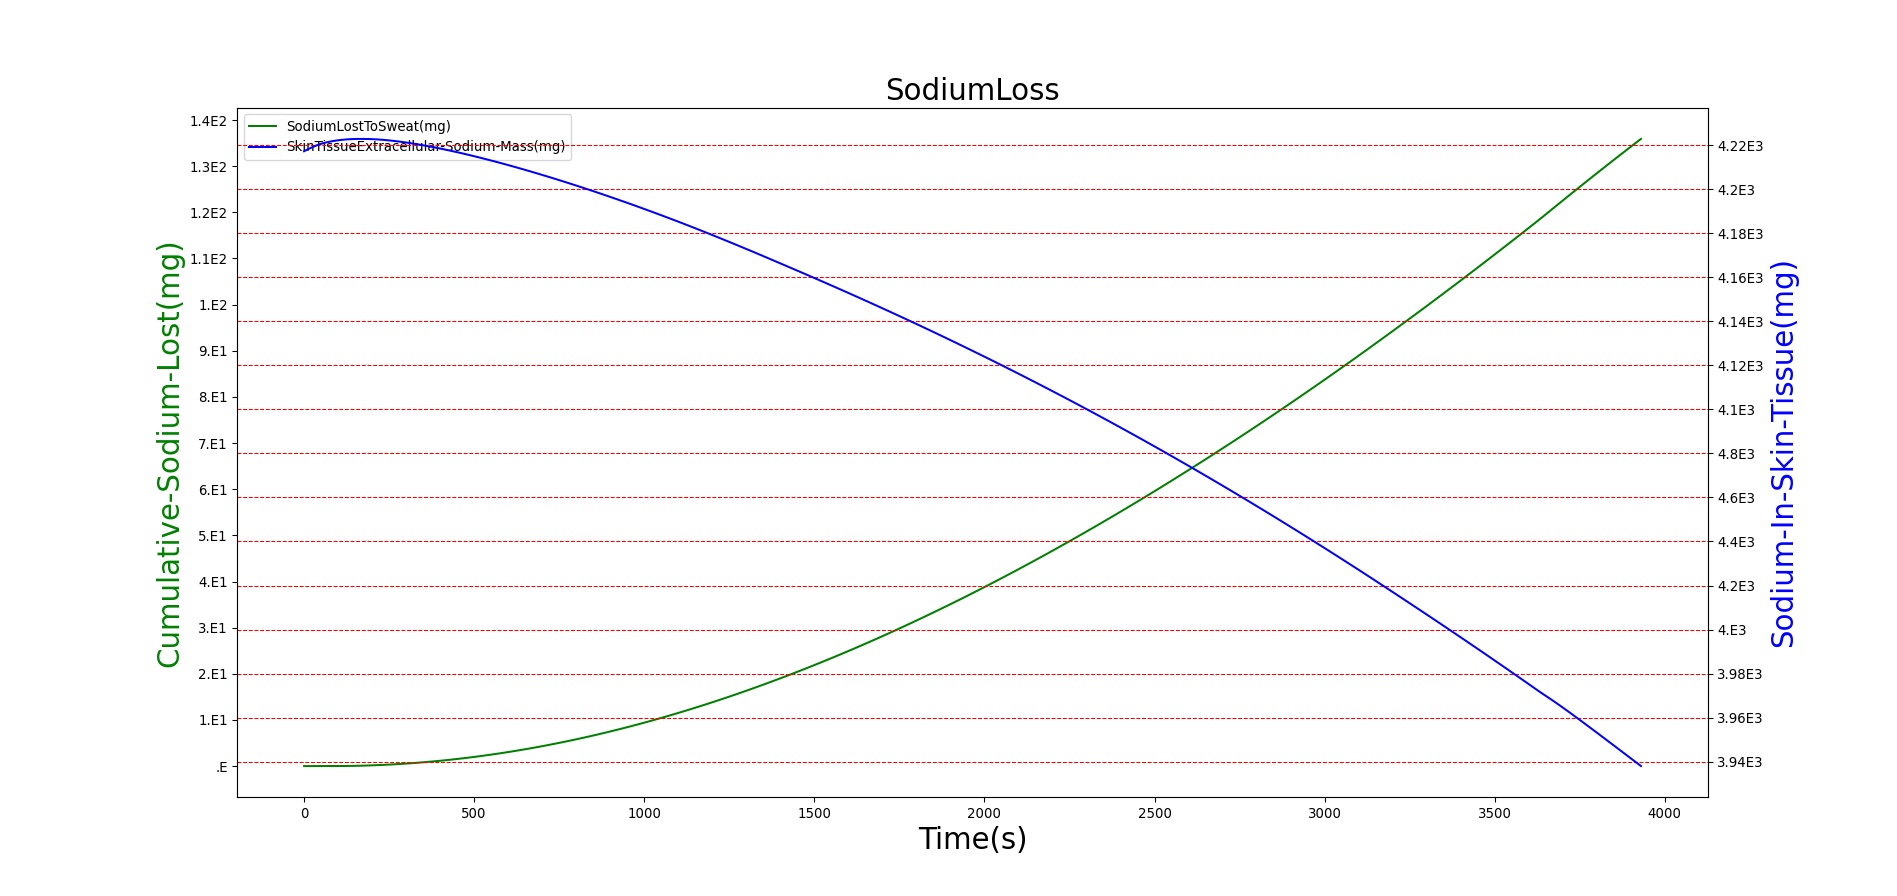
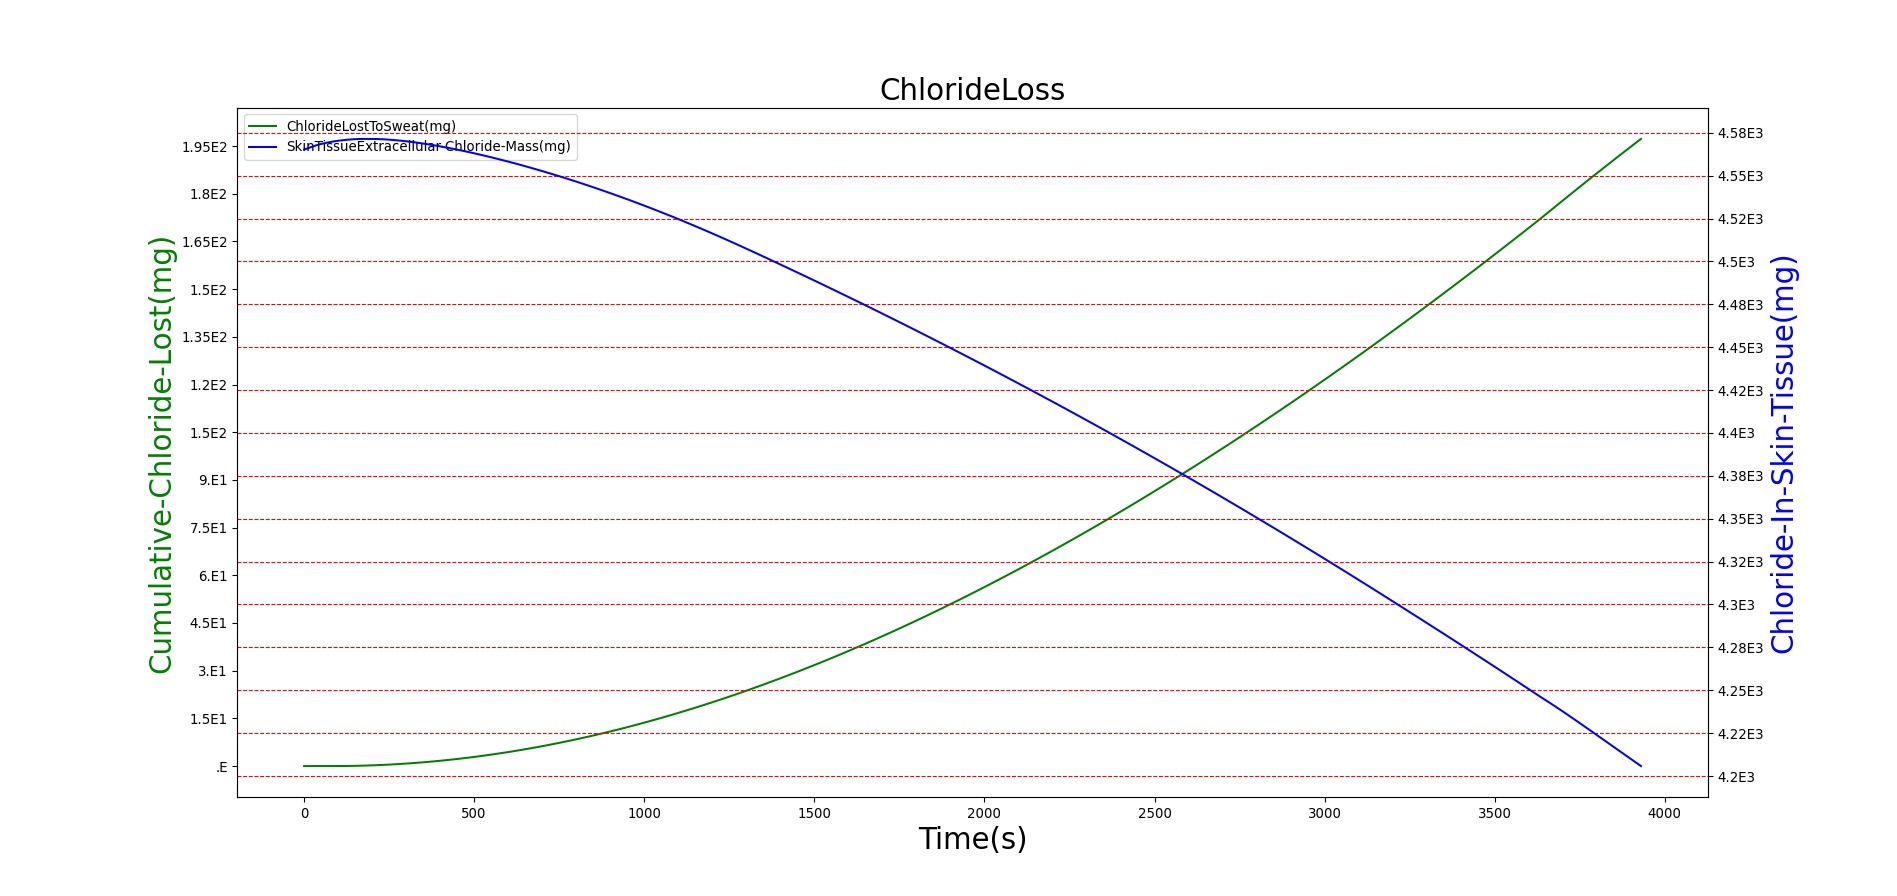
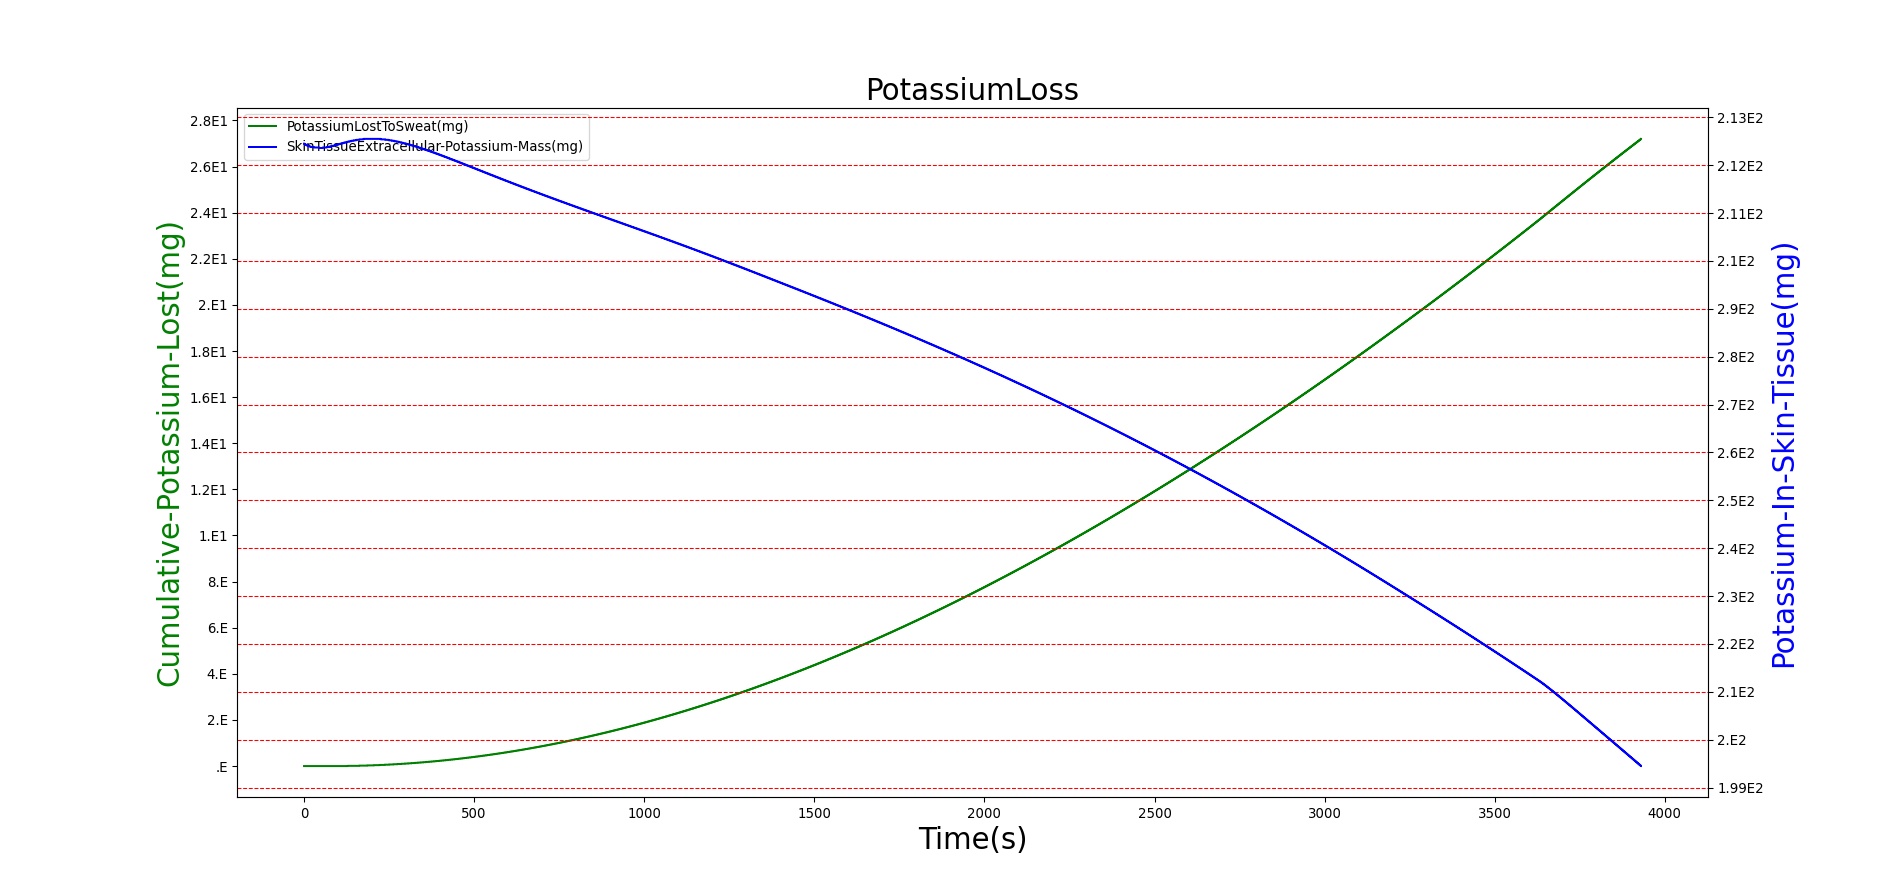
The sweat rate is calculated from a core temperature control function. The mass lost due to sweating is accounted for, and a flow source from the skin extravascular to ground path is updated to ensure fluid loss. Sodium, potassium, and chloride are removed from the body (specifically, the skin tissue extracellular compartment) as a function of the amount of fluid lost and each ion's respective average concentration in sweat ([Na+]=51.0 mM, [Cl-]=40.0 mM, [K+]=6.0 mM [321], [210]).
Update Heat Resistance
The variable core to skin heat transfer resistance is updated according to the inverse of the skin blood flow.
Exercise
The exercise function adds to the body’s basal metabolic rate a value that is specified by the exercise action. The metabolic rate set-point is specified by the action but limited by the amount of energy available. The energy available depends on the body's nutrient stores and ability to supply oxygen to the muscle tissue, where all exercise work occurs.
Process
Process Temperature Circuit
The generic circuit methodology developed for the BioGears Engine is used to solve for the temperature and heat transfer rate at each node or path. For more details, see Circuit Methodology.
Calculate Vital Signs
The core and skin temperatures are recorded in this function. In addition, the current metabolic state of the patient may trigger the following events: hypothermia, hyperthermia, and metabolic acidosis/alkalosis. These events are only triggered if the current state falls within the criteria of the specific event.
Postprocess
The Postprocess step moves everything calculated in Process from the next timestep calculation to the current timestep calculation. This allows all other systems access to the information when completing their preprocess analysis for the next timestep.
Features, Capabilities, and Dependencies
The Energy system is connected with every other BioGears system. Energy directly affects the Cardiovascular System through modification of vascular tone, heart rate, and heart contractility. This leads to modifications in the cardiac output and flow distribution in the cardiovascular circuit. In addition, there is indirect feedback through the modification of oxygen consumption and carbon dioxide production. Increased carbon dioxide production can lead to higher arterial carbon dioxide, which, in the case of severe hypercapnia, causes an Endocrine response in the form of epinephrine and norepinephrine release. There is direct feedback on the Respiratory system via modification of the ventilation frequency and driver pressure. The previously mentioned oxygen consumption and carbon dioxide production changes indirectly based on feedback to Respiratory driver, which is dependent on the arterial carbon dioxide and arterial oxygen. There is a dependence on the Gastrointestinal and Renal systems since they are the methods by which nutrients enter the body and metabolic wastes are cleared from the body. The Tissue System's freeing and storing of nutrients, such as hepatic and muscle glycogen, affects the total achievable metabolic rate requested in the Energy System.
The Environment circuit is directly connected to the energy’s internal temperature circuit to form the total temperature circuit. Modifications on the metabolic rate will therefore have a direct feedback on the environment temperature circuit, while changes in the ambient environment temperature will have a direct feedback on the metabolic rate.
Additional dependence on the cardiovascular system comes from the extravascular to vascular connection. The cardiovascular circuit is connected to the extravascular circuit via singular paths from the tissue-equivalent vascular node to the tissue node. These singular paths are formed by a flow resistance and contain a compliance which stores the extravascular volume.
Patient Variability
The basal metabolic rate is computed from the sex, height, weight, and age of the patient using the Harris-Benedict formula and will be directly affected by patient variability. Other indirect effects, such as fluid compositional changes due to sweating, may be observed. As with all of the BioGears systems, the energy system is validated using the BioGears Standard Male patient. A detailed discussion of patient variability in BioGears is available in the Patient Methodology report.
Assumptions and Limitations
The Energy system assumes a bulk representation of some of its metabolic substances to avoid tracking all possible biochemical reactants and products. It assumes that all carbohydrates are stored in the tissue as glucose. A similar assumption is made for lipids. The bulk representation of all lipids is tripalmitin. It is not converted into its fatty acid constituents in the blood stream. This assumption is carried through to ketones. All ketones are assumed to be acetoacetate; beta-hydroxybutyrate and acetone are not modeled. Furthermore, when amino acids are considered from a metabolic standpoint, it can be assumed that they are all alanine. It is assumed that all of these substances move with the flow into and out of the extravascular space.
Actions
Exercise
The exercise action is initiated by specifying any of four exercise types for the patient to participate in: Generic Exercise, Cycling Exercise, Running Exercise, or Strength Exercise.
Generic Exercise Generic exercise is an overarching exercise type in BioGears meant to simulate any intensity or desired work rate not achievable through other exercise types. The exercise intensity is a number between 0 and 1 that defines the requested fraction of the body's maximal work rate, which if not specified in the patient file is calculated using the patient's age and gender [plowman2013exercise]. For instance, the average adult male has a maximal work rate of approximately 1200 Watts [138]; therefore, a user-specified exercise intensity of 0.5 would request a work rate of 600 Watts from the body. Table 1 shows the approximate exercise intensity for some common activities executed by an average adult male. The approximate mechanical power produced by an adult male is also included in the table.
Cycling Exercise Cycling exercise simulates a subject on a bicycle and calculates metabolic exertion using the input parameters of cadence and power. Cadence is a frequency value referring to the number of rotations of the pedals in a given time period. In cycling, power is a expressed as work or energy produced from pedalling. In BioGears, a weighted pack can also be attatched to the subject for the duration of the exercise to increase intensity.
Running Exercise Running exercise simulates cardiovascular exercise by means of walking/running using input parameters of speed and incline. Speed is a length per unit time measurement to identify pace. Incline is a fractional representation of percent incline (whereas a 2 percent incline would be equivalent to 0.02 in BioGears). Additionally, a weighted pack can also be attatched to the subject for the duration of the exercise to increase intensity.
Strength Exercise Strength exercise offers a basic representation of body weight and weighted strength exercises through weight and repetitions inputs. Weight refers to the additional mass (zero for body weight exercises) being lifted per repeition while the number of repeitions is a scalar value. The current model estimates a generic maximum rep strength exercise to be approximately twice the patients body weight, though this will hopefully be an adjustable parameter in future expansions.
| Activity | Exercise Intensity | Mechanical Power (W) |
|---|---|---|
| All muscles in the body working all-out [138] | 1.0 | 1200 |
| All-out cycling with resistance, sustainable for approx. 8 seconds [25] | 0.8 | 1000 |
| Rowing 6.1 m/s on an ergometer [53] | 0.54 | 650 |
| Running at about 7.1 m/s (16 mph) [154] | 0.36 | 430 |
| 'Typical' Level Cycling [144] | 0.1 | 120 |
| Jogging at about 2.2 m/s (5 mph) [154] | 0.06 | 70 |
| Rest | 0.0 | 0 |
The exercise capacity of the body is physiologically and psychologically limited [239]. The amount of work produced by the exercise action in BioGears is limited by the nutrients available for consumption; there is currently no psychological fatigue implemented in BioGears. For more information about the consumption of nutrients and their relation to available energy, see the Tissue Methodology.
There are three output parameters associated with the exercise action: the achieved exercise level, the fatigue level, and the total work rate level.
- Achieved exercise level: This is the fraction of requested work that the body is able to achieve. For instance, if a work rate of 300 Watts is requested and the body is able to deliver 300 Watts, then the achieved exercise level will be 1.0. After some time, the body's energy levels will be depleted, and it will only be able to produce a fraction of the requested work rate, so the achieved exercise level will be less than 1.0.
- Fatigue level: This is the exhaustion level of the body. A fatigue level of 1.0 indicates that the body has no energy available to do work. At low work rates the fatigue level increases slowly, and the rate of fatigue increase is related to type of metabolism producing the energy (i.e. aerobic or anaerobic).
- Total work rate level: This is the fraction of the full work rate capacity of the body at which the body is currently working. For example, if the rested body is capable of producing a maximum of 1200 Watts of power for some amount of time, then that body working a rate of 600 Watts would have a work rate level of 0.5. This output is similar to the exercise intensity input.
Conditions
Starvation
The starvation functionality simulates an extended time period without nutrient intake. This is accomplished by depleting nutrient storage and blood substance concentrations based on the duration of starvation. For relatively short (<5 days) periods of starvation, both the body's hepatic glycogen and temporary protein stores are depleted, and so these substances' starved values can be set based on long-duration BioGears runs, in which the behaviors of substances are already validated. Similarly, stored fat, muscle glycogen, and muscle mass deplete at nearly linear rates, so these can also be interpolated based on long-duration BioGears runs. Body weight and other patient parameters based on mass proportions are set based on these values. Blood concentrations of glucose and ketones don't deplete in a linear fashion, so those starvation values are set based on data from [412], [116], [254], and [87]. These blood concentrations use a second-order fit to data up to 3 days, after which the concentrations are set to a constant, lowered value.
Dehydration
The dehydration condition is disabled in the current release. An improved dehydration condition will be included with the next release. Dehydration functionality is simulated completely in the Energy system. Similar to starvation, dehydration assumes a coarse timestep over which the fluid loss would occur. According to the Journal of Sports Medicine and Physical Fitness [327] , the average loss rate on the first day without liquid intake is 2600 milliliters. This rate decreases to 1600 milliliters for each subsequent day. The Energy system uses these average rates and the time since last liquid consumption to calculate volume lost. The volume decrement is distributed via volume weighting instantaneously to all vascular and tissue compartments.
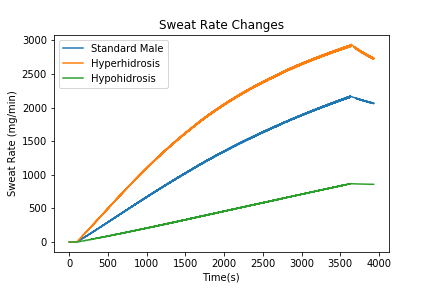
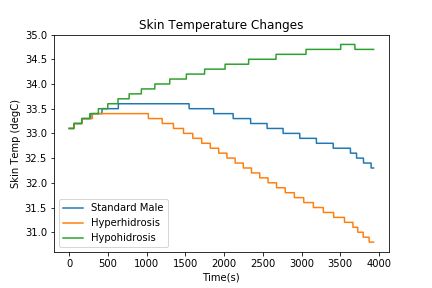
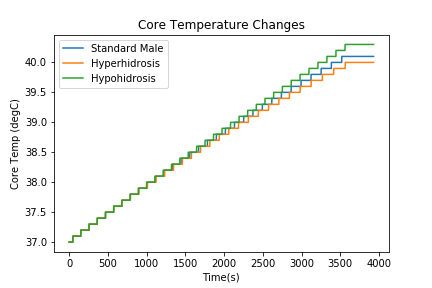
Hyperhidrosis and Hypohidrosis
**Excessive sweating and a lack of sweating are conditions that can be modified by the "Hyperhidrosis" parameter in the patient file. Using a scalar from -1 to 1, a more negative value will scale down the patient's sweat rate more in order to simulate hypohidrosis while a more positive value increases sweat rate to demonstrate hyperhidrosis [320]. The default value of zero refers to the standard sweat rate of a person, while a value of -1 can simulate the rare condition in which a person is unable to sweat at all.
Events
Hypothermia
Hypothermia is defined as a decrease in core temperature below 35 degrees Celsius [201]. In BioGears, this is triggered due to changes in the external environment, leading to increased heat transfer off the skin surface.
Hyperthermia
Hyperthermia is defined as an increase in core temperature above 38.8 degrees Celsius [201] . This may result from vigorous exercise, harsh environments, or infection. In BioGears, this event is achievable through the exercise action or by specifying a high-temperature environment.
Dehydration
Dehydration is classified by the World Health Organization as a three percent decrease in patient body mass due to fluid loss [390]. This is tested by summing the total fluid mass on the cardiovascular and extravascular circuits at each timestep. Currently, this event can be triggered during a hemorrhage action or through prolonged exercise.
Fatigue
The fatigue event is triggered whenever a tissue cannot provide the work it is asked to provide. Essentially, this means that a tissue either lacked oxygen or any available nutrients to fully meet its energy demand. The fatigue event is removed when there is no longer a deficit.
Results and Conclusions
Validation - Resting Physiologic State
| Energy | Expected Value | Engine Value | Percent Error | Notes |
|---|---|---|---|---|
| KetoneProductionRate(umol/min) | 308.000000[90] | 94.303616 | 106.236372% | |
| LactateProductionRate(mol/day) | 1.300000[263] | 0.335379 | 117.969087% | |
| SkinTemperature(degC) | 33.000000[144] | 33.000000 | 0.0% | |
| TotalMetabolicRate(kcal/day) | 1790.000000[300] | 1737.000000 | 3.005387% |
The resting system properties for the energy system are temperatures and metabolic production rates. From Table 2, it is shown that the temperatures meet the validation criteria extremely well for resting conditions. Ketone production rate is currently low because only the brain uses ketones, and then only during starved states. Because ketone behavior is most important during starved states, it was tuned to perform at better long-term timescales, where this validation occurs only over a few minutes. Lactate production is low likely due to its clearance not being tied to gluconeogenesis. This will be addressed in an upcoming release. Resting state temperatures are good.
Validation - Actions and Conditions
The Energy and Environment systems were validated for six scenarios encompassing a variety actions and environments. These include: exercise, cold water submersion (including active heating), carbon monoxide exposure, smoke inhalation, and a high altitude environment change. These scenarios were meant to test the dynamic feedback of the energy environment systems on both thermal regulation and internal physiology. There is good agreement with the expected results.
| Scenario | Description | Good | Decent | Bad |
|---|---|---|---|---|
| ColdWaterSubmersion | Patient is submerged in 10 C water for 1 hour. Removed for 10 minutes, and then actively heated for 20 minutes | 17 | 2 | 5 |
| HighAltitude | Patient enters 4000 m elevation environment for 15 minutes | 3 | 3 | 0 |
| ExerciseStages | Exercise for six minutes at increasing intensity with 2 minutes of rest in between stages. | 78 | 12 | 22 |
| ExerciseVO2max | Exercise at high intensity (430 watts) to exhaustion. | 1 | 0 | 0 |
| ExerciseSustained | Exercise at moderate intensity to demonstrate sweat loss capability. | 0 | 1 | 0 |
| CarbonMonoxide | Varied exposure to environmental carbon monoxide. | 20 | 4 | 0 |
| ForestFireFighter | Exposure to smoke and carbon monoxide. | 5 | 1 | 0 |
| Starvation | Patient consumes no nutrients for 72 hours. | 10 | 1 | 2 |
| Total | 134 | 24 | 29 |
Exercise
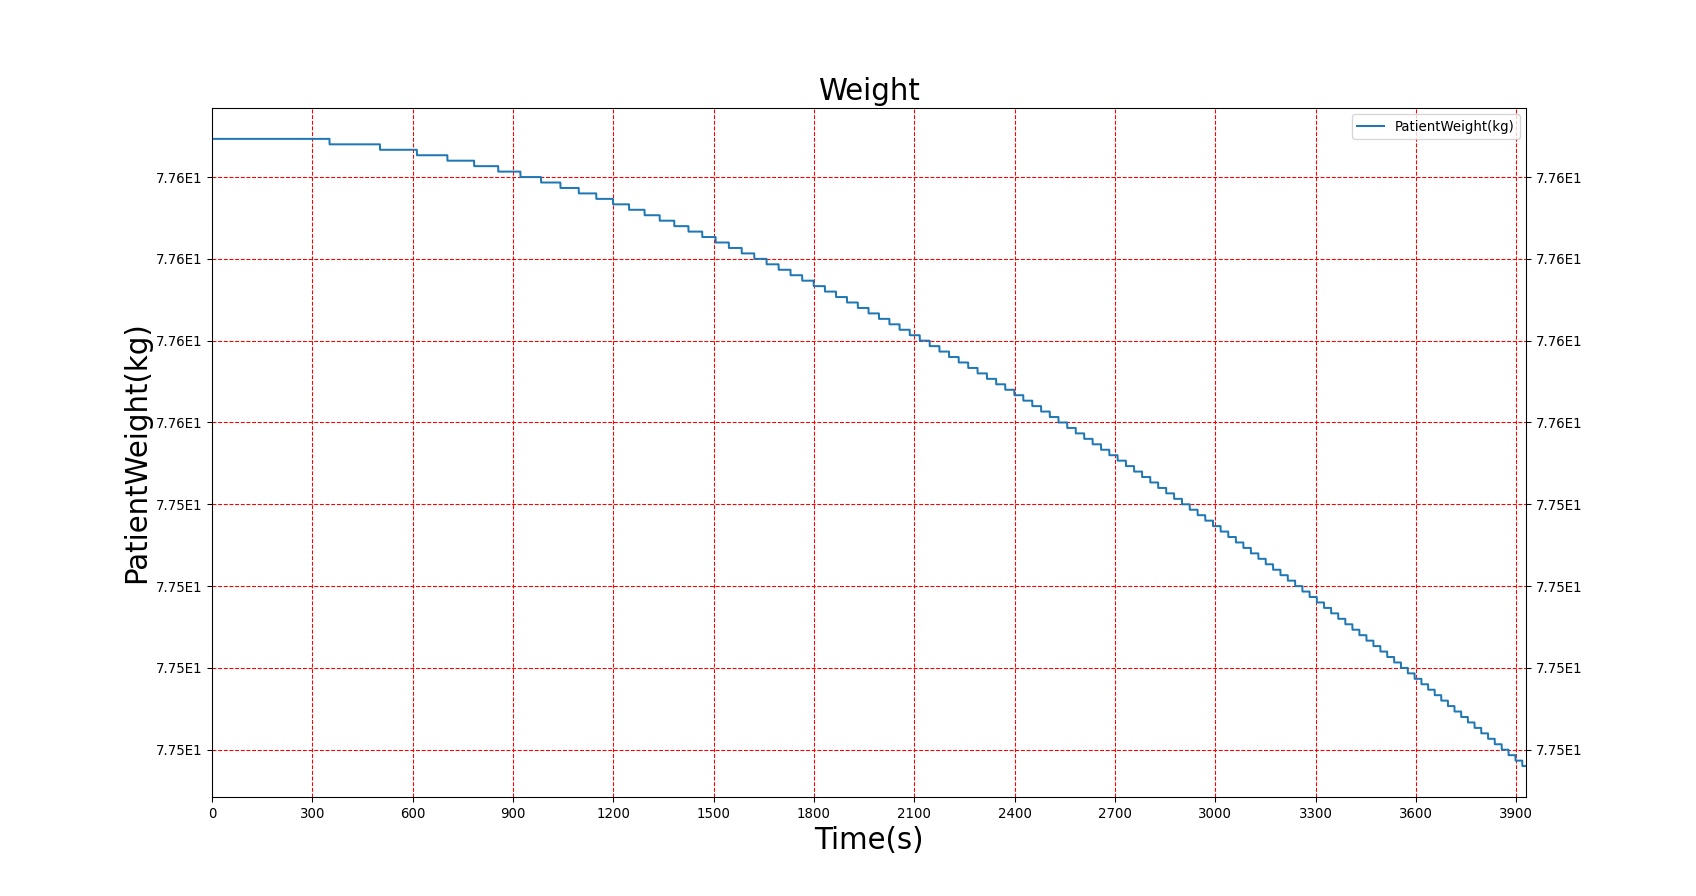
There are four scenarios for validation of the exercise action. The first scenario (Tables 4a-d) takes advantage of the abundance of experiments using variations of the Bruce protocol to study exercise physiology. In this scenario, the exercise intensity is periodically increased, with short breaks in between each exercise period. The second scenario (Table 5) qualitatively validates that a work rate threshold exists. The scenario is based on the assertion by [154] that a body working around the threshold for maximal oxygen uptake (approximately 430 watts) will only be able to perform at the desired level for about three minutes before reaching physiological limits. In the third scenario (Table 6 and Figure 4), an individual exercises at a moderate to heavy intensity for an hour and the total fluid and ion loss from sweat is assessed. Lastly, Table 7 demonstrates the change in core and skin temperatures during exercise in specific environmental conditions. The quantitative validation results are shown in the table below.
Table 4a. The dynamic response to exercise. 15 measures are compared to data reported in literature at 8 different times during increasing exercise intensity with intermittent rest, for a total of 120 points of comparison. The first intensity/rest period is shown in Table 4a.
| Segment | Notes | Occurrence Time (s) | Sampled Scenario Time (s) | Core Temperature (Celsius) | Peripheral Temperature (Celsius) | Heart Rate (beats/min) | Systolic Pressure (mmHg) | Diastolic Pressure (mmHg) | Mean Arterial Pressure (mmHg) | Stroke Volume (mL) | Cardiac Output (L/min) | Gut Blood Flow (L/min) | Systemic Vascular Resistance (mmHg-min/L) | Respiration Rate (breaths/min) | Tidal Volume (L) | Respiratory Exchange Ratio | Oxygen Consumption (L/min) | Urine Production Rate (mL/min) |
|---|---|---|---|---|---|---|---|---|---|---|---|---|---|---|---|---|---|---|
| Exercise Severity 0.0375 | 45 watts | 30 | 389 | Increase [91], [40] | No change or decrease [92] | 156% of baseline [91] | Increase 18.4% [91] | No change [91] | 1% increase [91] | 41.6% increase [91] | 225% of base [91] | reduced [94] | decrease [94] | Increase [99] | increase [99] | increase, maximum ~1.21 [169] | 1.33 [91] | decrease [218] |
| Exercise Severity 0 | rest 2 minutes | 390 | 509 | Increase [91] or no change [40] | No change or decrease [92] | Decreasing | Toward baseline [91] | No change [91] | Toward baseline [91] | Toward baseline [91] | Toward baseline [91] | Toward baseline [91] | Toward baseline [91] | Toward baseline [91] | Toward baseline [91] | No Data | Toward baseline [91] | No Data |
| Segment | Notes | Occurrence Time (s) | Sampled Scenario Time (s) | Core Temperature (Celsius) | Peripheral Temperature (Celsius) | Heart Rate (beats/min) | Systolic Pressure (mmHg) | Diastolic Pressure (mmHg) | Mean Arterial Pressure (mmHg) | Stroke Volume (mL) | Cardiac Output (L/min) | Gut Blood Flow (L/min) | Systemic Vascular Resistance (mmHg-min/L) | Respiration Rate (breaths/min) | Tidal Volume (L) | Exchange Ratio (Or Respiratory Quotient) | Oxygen Consumption (L/min) | Urine Production Rate (mL/min) |
|---|---|---|---|---|---|---|---|---|---|---|---|---|---|---|---|---|---|---|
| Exercise Severity 0.075 | 90 watts | 510 | 869 | Increase [91], [40] | No change or decrease [92] | 197% of baseline [91] | 34.4% increase [91] | No change [91] | 8.38% increase [91] | 29.9% increase [91] | 267% of base [91] | reduced [94] | decrease [94] | Increase [99] | increase [99] | increase, maximum ~1.21 [169] | 2.05 [91] | decrease [218] |
| Exercise Severity 0 | rest 2 minutes | 870 | 989 | Increase [91] or no change [40] | No change or decrease [92] | Decreasing | Toward baseline [91] | No change [91] | Toward baseline [91] | Toward baseline [91] | Toward baseline [91] | Toward baseline [91] | Toward baseline [91] | Toward baseline [91] | Toward baseline [91] | No Data | Toward baseline [91] | No Data |
| Segment | Notes | Occurrence Time (s) | Sampled Scenario Time (s) | Core Temperature (Celsius) | Peripheral Temperature (Celsius) | Heart Rate (beats/min) | Systolic Pressure (mmHg) | Diastolic Pressure (mmHg) | Mean Arterial Pressure (mmHg) | Stroke Volume (mL) | Cardiac Output (L/min) | Gut Blood Flow (L/min) | Systemic Vascular Resistance (mmHg-min/L) | Respiration Rate (breaths/min) | Tidal Volume (L) | Exchange Ratio (Or Respiratory Quotient) | Oxygen Consumption (L/min) | Urine Production Rate (mL/min) |
|---|---|---|---|---|---|---|---|---|---|---|---|---|---|---|---|---|---|---|
| Exercise Severity 0.1583 | 190 W | 990 | 1349 | Increase [91], [40] | No change or decrease [92] | 237% of baseline [91] | 46.4% increase [91] | No change [91] | 14.1% increase [91] | 36.4% increase [91] | 336% of base [91] | reduced 25-50% [94] | decrease [94] | Increase [99] | increase [99] | increase, maximum ~1.21 [169] | 2.75 [91] | decrease [218] |
| Exercise Severity 0 | rest 2 minutes | 1350 | 1469 | Increase [91] or no change [40] | No change or decrease [92] | Decreasing | Toward baseline [91] | No change [91] | Toward baseline [91] | Toward baseline [91] | Toward baseline [91] | Toward baseline [91] | Toward baseline [91] | Toward baseline [91] | Toward baseline [91] | No Data | Toward baseline [91] | No Data |
| Segment | Notes | Occurrence Time (s) | Sampled Scenario Time (s) | Core Temperature (Celsius) | Peripheral Temperature (Celsius) | Heart Rate (beats/min) | Systolic Pressure (mmHg) | Diastolic Pressure (mmHg) | Mean Arterial Pressure (mmHg) | Stroke Volume (mL) | Cardiac Output (L/min) | Gut Blood Flow (L/min) | Systemic Vascular Resistance (mmHg-min/L) | Respiration Rate (breaths/min) | Tidal Volume (L) | Exchange Ratio (Or Respiratory Quotient) | Oxygen Consumption (L/min) | Urine Production Rate (mL/min) |
|---|---|---|---|---|---|---|---|---|---|---|---|---|---|---|---|---|---|---|
| Exercise Severity 0.3583 | 430 W | 1470 | 1829 | Increase [91], [40] | No change or decrease [92] | 257% of baseline [91] | 56.8% increase [91] | No change [91] | 117.9% increase [91] | 31.2% increase [91] | 350% of base [91] | reduced 25-50% [94] | decrease [94] | 59 +/- 9 [99] | 3.1 +/- 0.4 [99] | increase, maximum ~1.21 [169] | 3.36 [91] | decrease [218] |
| Exercise Severity 0 | rest 2 minutes | 1830 | 1950 | Increase [91] or no change [40] | No change or decrease [92] | Decreasing | Toward baseline [91] | No change [91] | Toward baseline [91] | Toward baseline [91] | Toward baseline [91] | Toward baseline [91] | Toward baseline [91] | Toward baseline [91] | Toward baseline [91] | No Data | Toward baseline [91] | No Data |
| Segment | Notes | Occurrence Time (s) | Duration of Full Exercise |
|---|---|---|---|
| Exercise Severity 0.3583 | Exercise intensity of 0.3583 is a requested work rate of 430 watts. | N/A | ~ 3 min [154] |
| Action | Notes | Occurrence Time (s) | Sampled Scenario Time (s) | Fluid Mass Lost |
|---|---|---|---|---|
| Exercise Severity 0.234 | Working at about 65% of VO2 max | 30 | 3630 | 0.7-1.2 kg [16] |
| 
|
| 
|
Table 7. The effect of sustained exercise (three hours) on blood glucose and insulin.
| Duration of Exercise (mins) | Glucose (mg/dL) | Insulin (ug/mL) |
|---|---|---|
| 0 | 91.7 [395] | 16.8 [395] |
| 15 | 95.1 [395] | 14.6 [395] |
| 30 | 96.4 [395] | 13.5 [395] |
| 60 | 96.7 [395] | 12.2 [395] |
| 90 | 95.8 [395] | 11.9 [395] |
| 120 | 94.6 [395] | 11.4 [395] |
| 150 | 93.5 [395] | 10.7 [395] |
| 180 | 91.8 [395] | 10.0 [395] |
Table 8. The results for changes in the thermal circuit during exercise in the heat.
| Action | Notes | Occurrence Time (s) | Sampled Scenario Time (s) | Skin Temperature | Core Temperature |
|---|---|---|---|---|---|
| Exercise in 37 degC | Working at about 50% of VO2 max | 2400 | 4260 | 35.7 degC [355] | 38.7 degC [355] |
There are several physiological measures that are failing validation for the exercise action. However, most of the failing measures will be addressed by improvements to the chemoreceptor model planned as a part of the BioGears nervous system. The oxygen consumption and urine production measures may still fail validation during exercise after the nervous system is fully implemented. The development team is currently making plans to address those failures.
Cold Water Submersion
| Action | Notes | Occurrence Time (s) | Sampled Scenario Time (s) | Core Temperature (Celsius) | Peripheral Temperature (Celsius) | Metabolic Rate | Heart Rate (beats/min) | Systolic Pressure (mmHg) | Diastolic Pressure (mmHg) | Mean Arterial Pressure (mmHg) | Cardiac Output (L/min) |
|---|---|---|---|---|---|---|---|---|---|---|---|
| Environment File Change: Submerged in 5 C water | Patient is submerged in cold for 60 minutes | 50 | 3650 | Decrease to 35 degC [394] | Decrease | Increase to between 300 and 350 W [394] | Decrease [117] | No change [91] | If mild hypothermia (Core Temp 32-35 C) Increase [201] | If mild hypothermia (Core Temp 32-35 C) Increase [201] | If mild hypothermia (Core Temp 32-35 C) Increase If moderate or severe (Core Temp < 32 C) Decrease [201] |
| Environment File Change to Standard Environment | 3650 | 4250 | Decrease below 35 [394] | Increase | Increase above 350 W [394] | Decrease [98] | Decrease [98] | Decrease [98] | Decrease [98] | Decrease [98] | |
| Active Heating at 1000 btu/hr | 480 | 5450 | Increase to between 36 and 38 degC [394] | Increase | Decreasing to below 80 W [394] | Decrease [98] | Decrease[98] | Decrease [98] | Decrease [98] | Decrease [98] |
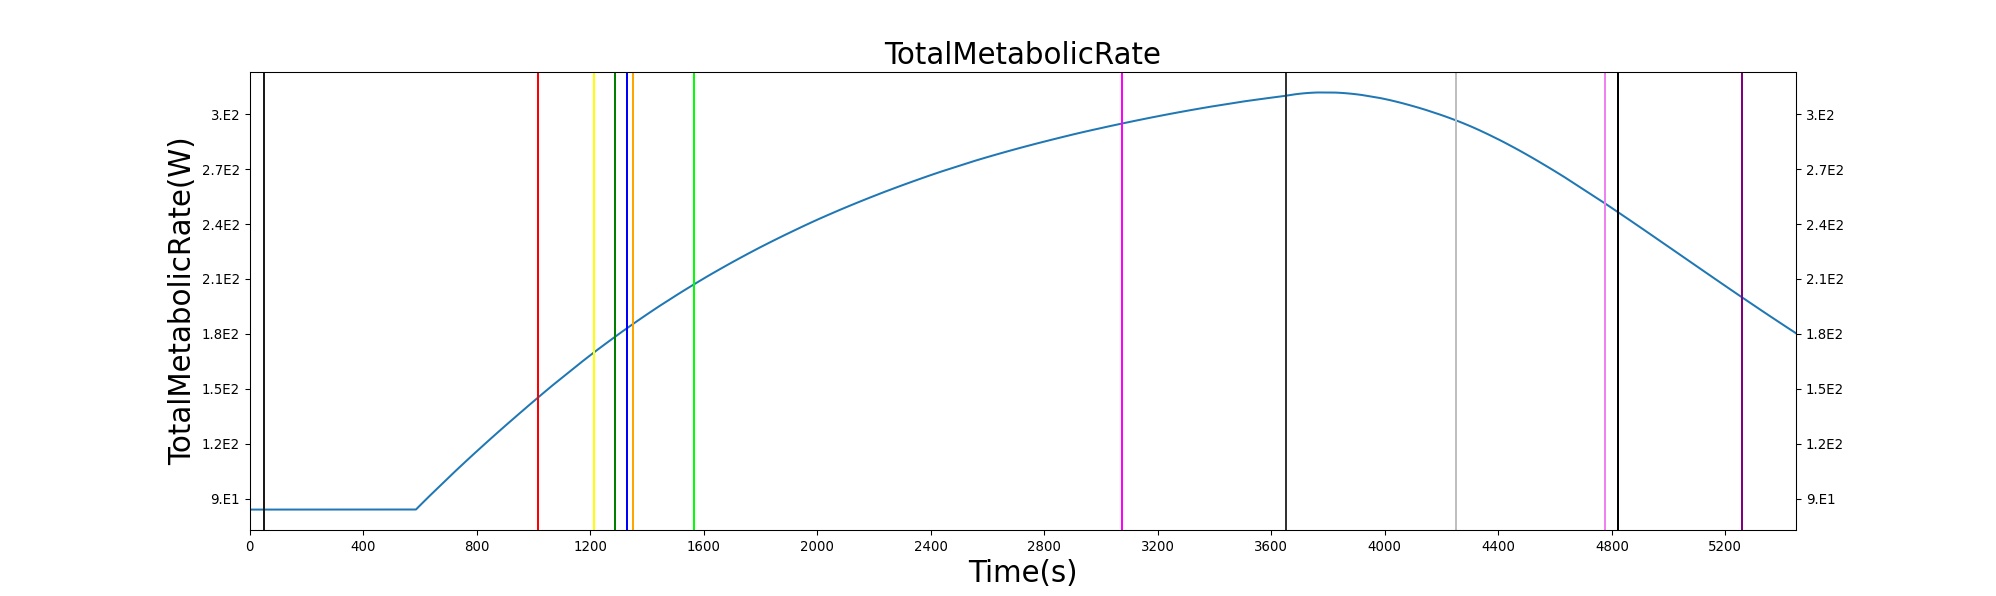
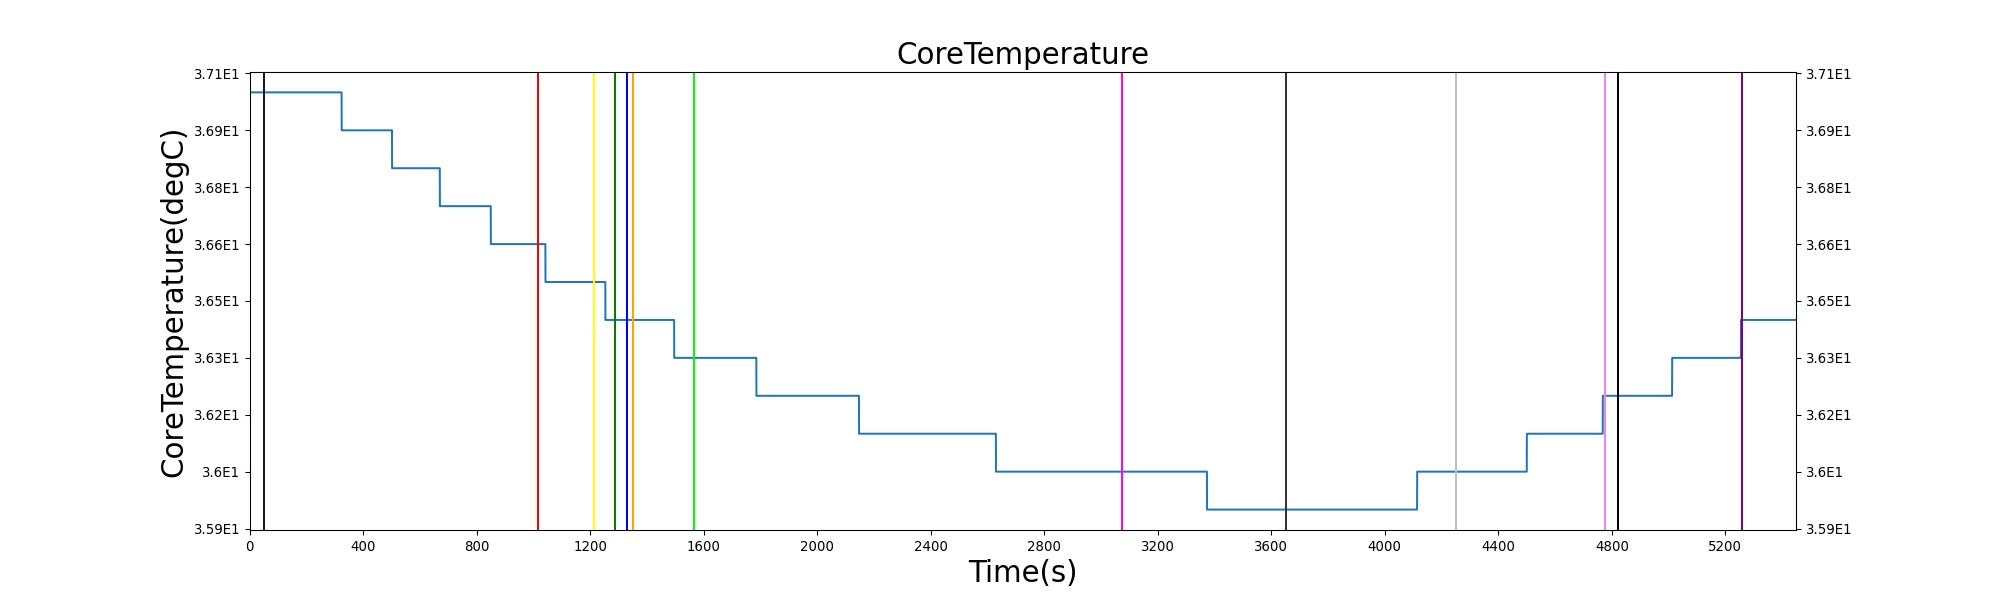
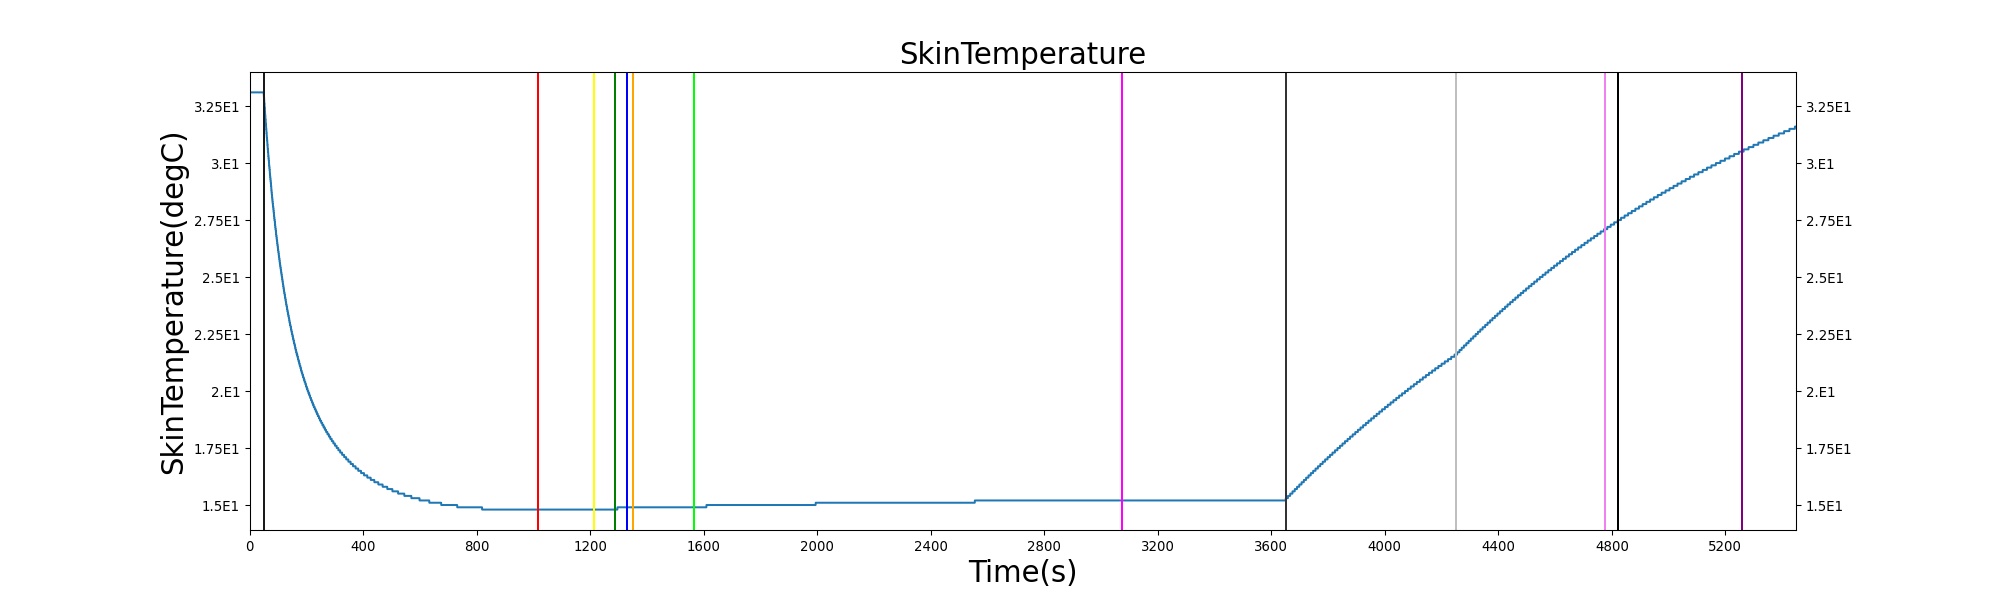
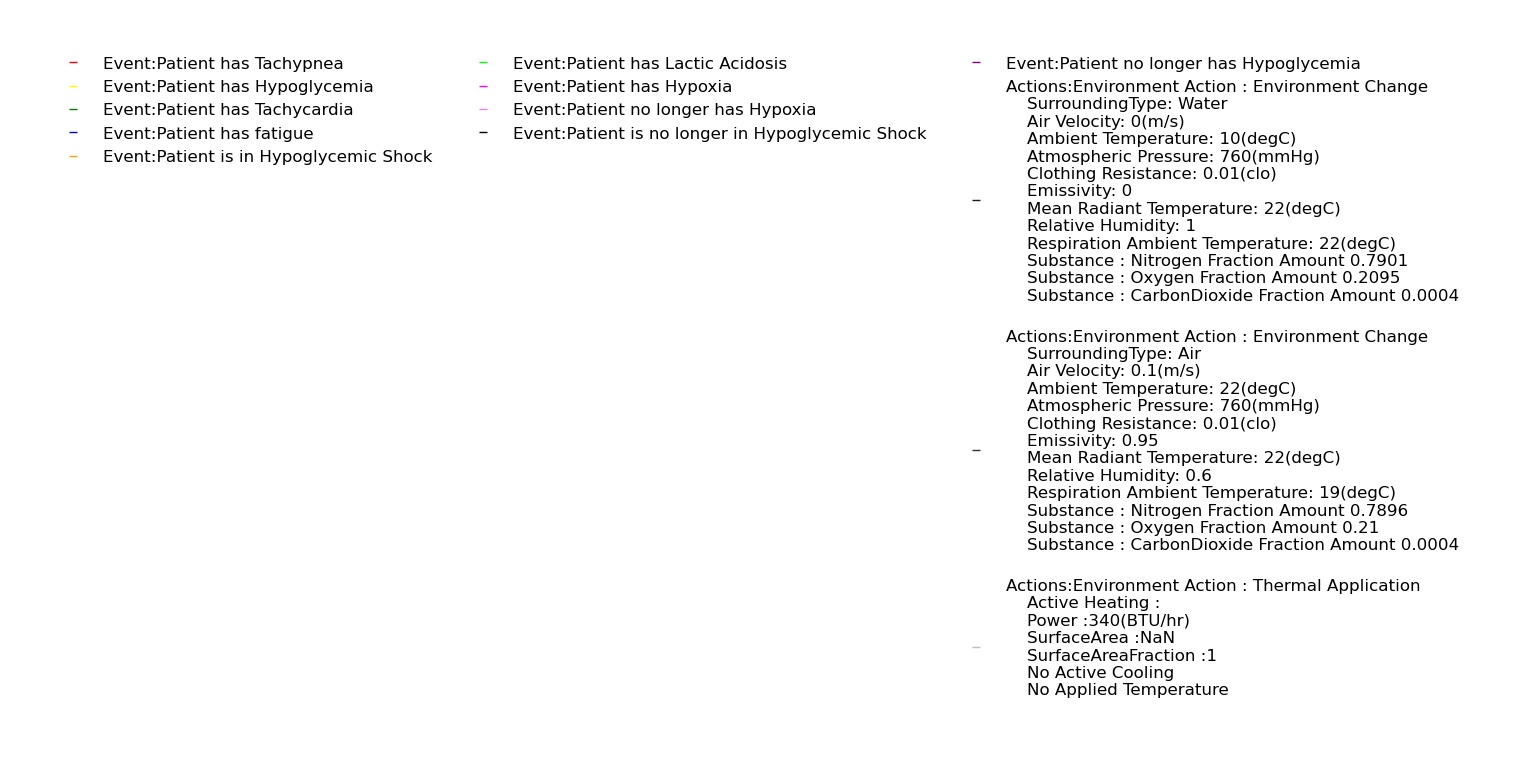
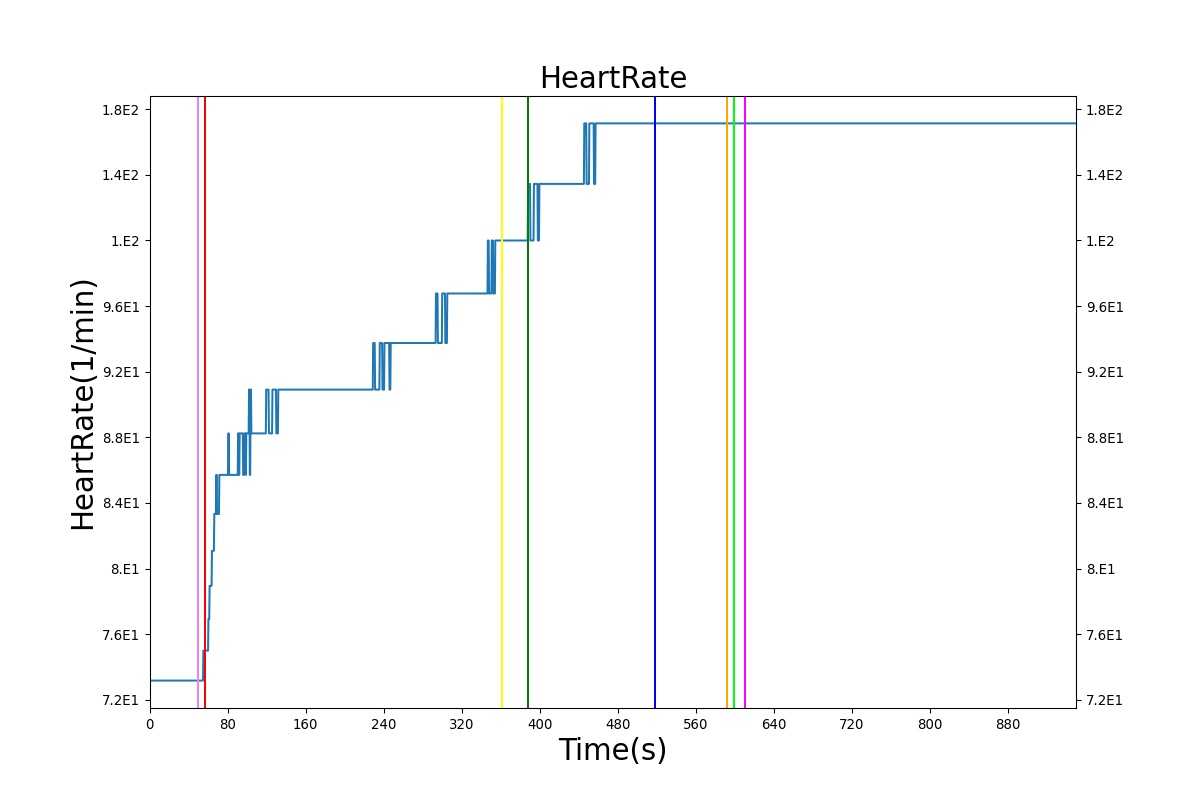
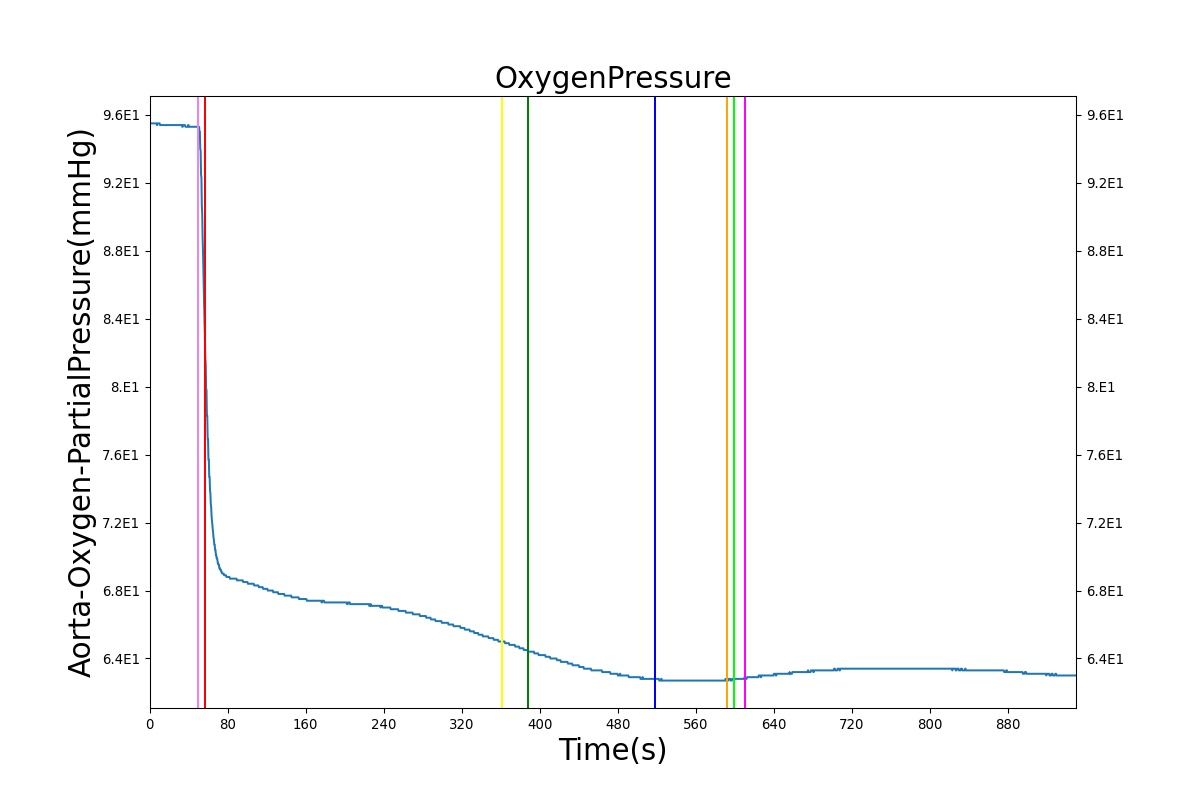
At a scenario time of 50 seconds, the patient is submerged in water with a temperature of 10 degrees Celsius. The patient remains submerged for one hour, and then is removed from the water. The patient remains in the ambient environment for 10 minutes before active heating is applied. The power output of the heating device is 340 btu/hr. Active heating continues for 20 minutes, and then the scenario ends. The immediate response to cold water submersion is a drop in skin temperature. This occurs due to a dramatic increase in the skin convective heat transfer due to a shift from air convection to water convection. The core temperature declines due to increased heat transfer from core to skin. The drop in core temperature initiates a shivering response, leading to a rise in metabolic rate. Additional feedback comes in the form of vasoconstriction of the skin blood vessels. This helps to reduce the heat transferred from the core to skin. These two forms of feedback allow the core temperature to stabilize around 35 degrees Celsius. There is an increase in heart rate and respiration rate, initially due to a nervous response to the exposure to cold water. The increase in respiration rate and heart rate are maintained to accommodate the increased oxygen consumption and carbon dioxide production at the elevated metabolic rate. Following the return to the ambient environment, there is an immediate rise in skin temperature, with the core temperature following. The core temperature rise is not expected during this time period according to validation data. A continued decline in core temperature is expected. The observed increase in core temperature is due to a low heat capacitance used in the model and not accounting for residual water remaining on the skin surface after being removed from the water. The capacitance can be adjusted to a higher value, which would lead to the core temperature responding more slowly to changes in heat transfer over time. In addition, the Environment heat transfer methodology could be updated to account for additional heat transfer due to water remaining on the skin surface after exiting submersion. At the onset of active heating, the skin temperature and core temperature continue to rise. This coincides with the expected validation outcome.
High Altitude Change
| 
|
| 
|
| |
| Action | Notes | Occurrence Time (s) | Sampled Scenario Time (s) | Heart Rate (beats/min) | Oxygen Saturation (%) | Respiration Rate (breaths/min) | Systolic Blood Pressure | Cardiac Output (mL/min) | Myocardium Flow (mL/min) |
|---|---|---|---|---|---|---|---|---|---|
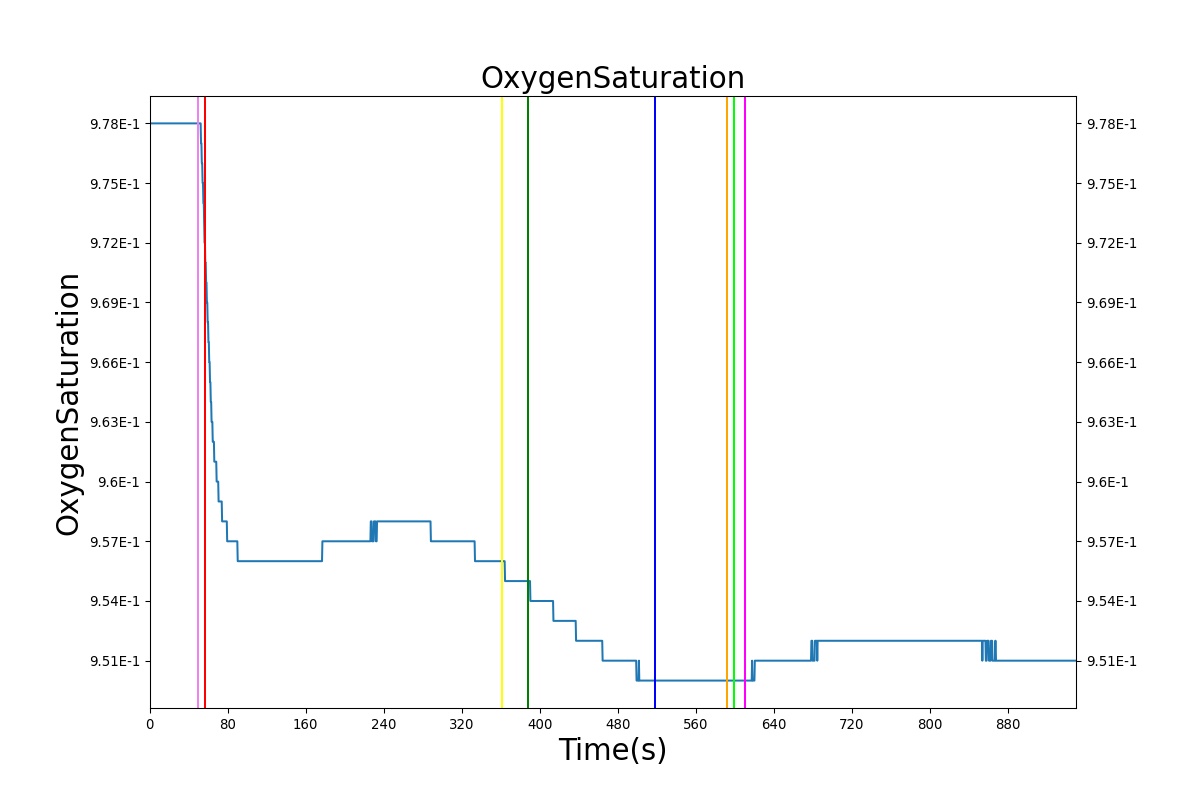
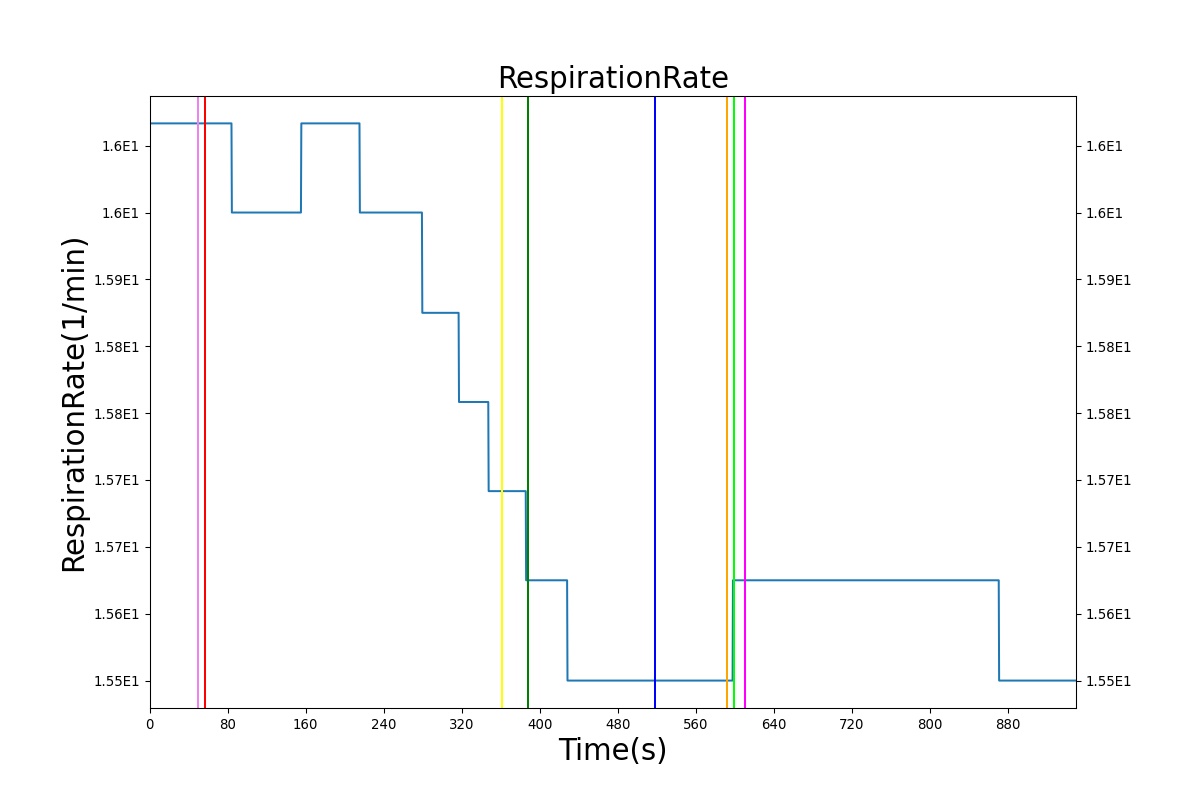
| Environment File Change to an altitude of 3000 meters | Atmospheric pressure at 3000m is approximately 70 kPa | 50 s | 950 | 7% increase [101] | 7% decrease [101] | 5% increase [101] | Decrease [260] | No change [260] | Increase [260] |
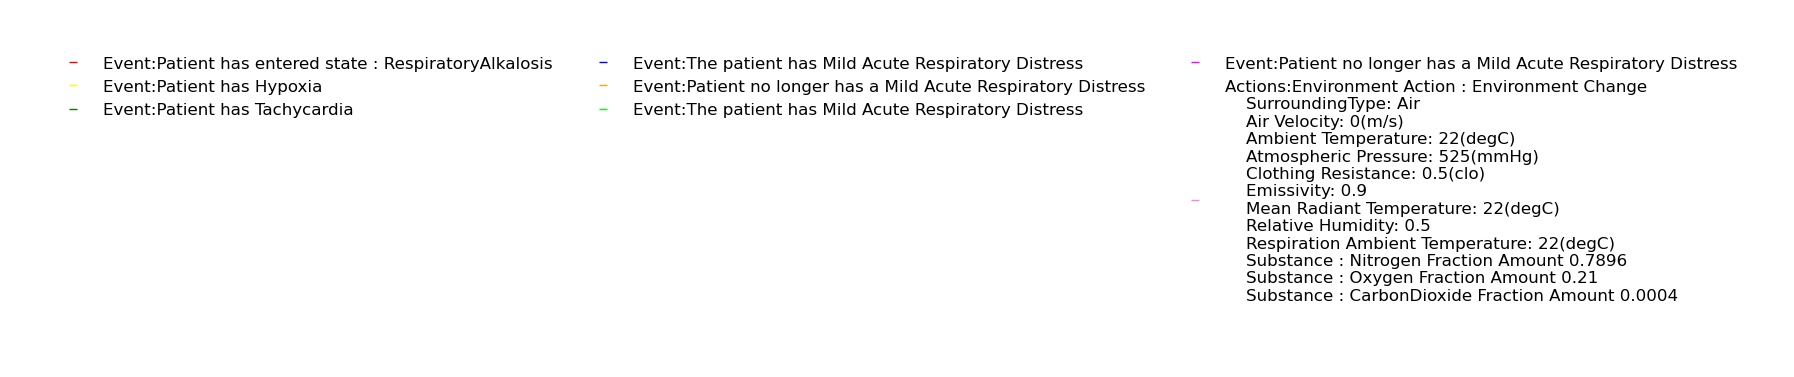
This scenario is used to simulate the effects of low oxygen due to high altitude. At 30 seconds, the surrounding environment is changed to an equivalent elevation of 4000 meters, resulting in a drop in atmospheric pressure from 760 mmHg to 525 mmHg. The patient remains in the reduced pressure environment for 15 minutes. The immediate response is a decrease in arterial oxygen due to the reduced partial pressure in the environment. This leads to a decrease in the blood oxygen saturation, which is in line with the expected validation data. The reduced arterial oxygen causes an increase in the heart rate. This increase is currently determined from epinephrine release due to a hypoxia event being triggered. Another expected result of the epinephrine release is a respiration rate increase. This effect is nullified from the reduction in atmospheric carbon dioxide, which allows for larger quantities of carbon dioxide to diffuse out of the alveoli. The increased diffusion leads to lower arterial carbon dioxide partial pressures, which is used to drive the respiratory frequency. This counter balances the effect of epinephrine in the system, thus causing a slight decrease in respiration rate.
Starvation
The starvation condition is validated at 72 hours, which allows for direct comparison of blood concentration values in [zauner2000starvation], [116], [254], and [87]. Since the glucose and ketone concentrations for the starvation condition are directly set based on these sources, it is no surprise that they meet validation. More satisfaction is gained from the passing values for insulin, respiratory quotient, gluconeogenesis rate, ketogenesis rate, and urea, since those values are not directly set by the starvation condition, but are instead generated by other metabolic processes in BioGears. These lend credibility to the metabolic models. The metrics that did not pass are body weight and plasma ion concentrations, both of which have outstanding tasks for future BioGears improvements.
| Condition | Notes | Sampled Scenario Time (s) | Aorta Glucose Concentration (mg/dL) | Vena Cava Insulin Concentration (ug/L) | Aorta Ketones Concentration (mg/dL) | Respiratory Quotient | Body Weight (kg) | Hepatic Gluconeogenesis Rate (g/day) | Ketogenesis Rate (g/day) | Aorta Triacylglycerol Concentration (mg/dL) | Aorta Urea Concentration (mg/dL) | Sodium Plasma Concentration (mg/dL) | Potassium Plasma Concentration (mg/dL) | Calcium Plasma Concentration (mg/dL) | Chloride Plasma Concentration (mg/dL) |
|---|---|---|---|---|---|---|---|---|---|---|---|---|---|---|---|
| 72 hour starvation condition applied | For ketones, acetoacetate and beta hydroxybutyrate values were summed, when available. | 60 | 64.86 [412] 61.25 [116] 66.47 [254] 61.43 [87] | .337 [412] .129 [116] .637 [254] | 43.58 (beta hydroxybutyrate only) [412] 25.52 [116] 31.26 [254] 43.49 | .72 [412] | 2.5% Decrease [412] | [99,124] [116] 165 [297] | [83,115] [116] | 75.89 [412] | 24.62 [87] | 311.28 [87] | 15.48 [87] | 9.7 [87] | 354.5 [87] |
Dehydration
Conclusions
The BioGears Energy system has provided a method for handling metabolic consumption and production and heat transfer in the human body. This system is fundamentally connected to all of the other systems, and provides dynamic feedback according to changes in the external environment. In its current state, the energy system accurately calculates resting thermal physiology and nutrient consumption and production. The energy system can be used by developers who wish to model thermal changes due to the environment or through strenuous activity. This may be a simple simulation, or connection with a mannequin for real-time interfacing.
Future Work
Coming Soon
- The maximum work rate will scale with physical conditioning, fed/starvation levels, and body composition.
- The nervous system will contain numerous chemoreceptor-related feedback mechanisms that will correct many of the exercise validation failures such as heart rate and blood pressure.
- The response of body core temperature to exercise will be improved.
- Sweat composition will include more than just water.
Recommended Improvements
- Increased discretization of the temperature circuit: This would allow for increased fidelity of the temperature solution and prediction of varying levels of water submersion.
- Include psychological effects. For example, incorporate psychology into fatigue using a 'mettle' parameter.
- Switch exercise accounting from physical work rate to metabolic heat production.
- A true basal metabolic rate with differentiation from resting metabolic rate.
Appendices
Acronyms
RQ - Respiratory Quotient BMR - Basal Metabolic Rate
Data Model Implementation
Energy
Compartments
- InternalCore
- InternalSkin
- InternalGround


